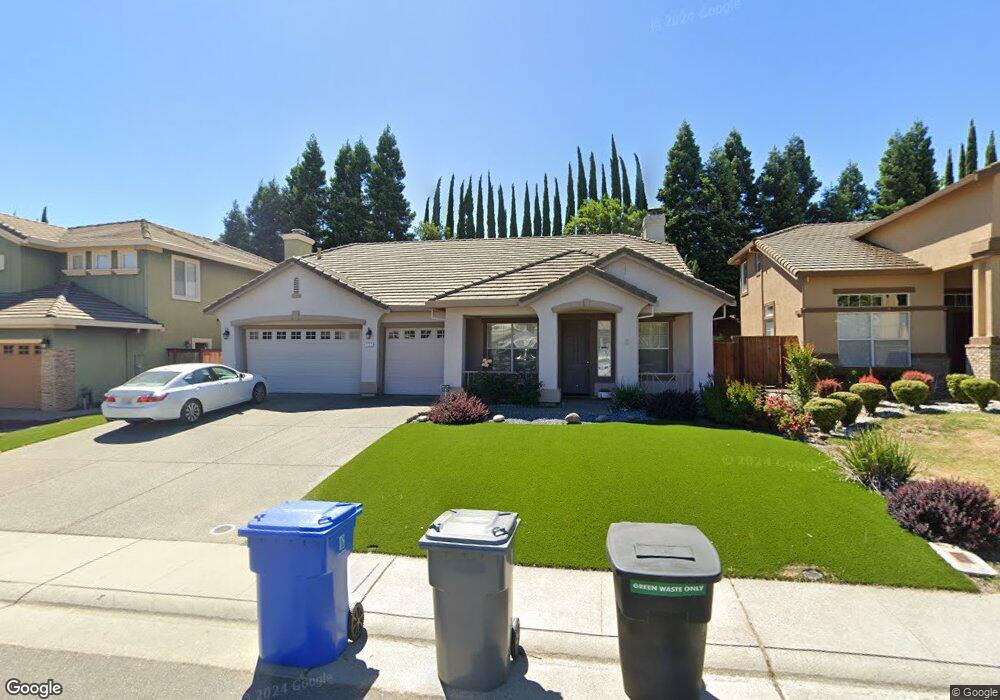
777 Duncan Way Folsom, CA 95630
Prairie Oaks NeighborhoodEstimated Value: $509,000 - $839,000
4
Beds
2
Baths
2,264
Sq Ft
$325/Sq Ft
Est. Value
About This Home
This home is located at 777 Duncan Way, Folsom, CA 95630 and is currently estimated at $736,845, approximately $325 per square foot. 777 Duncan Way is a home located in Sacramento County with nearby schools including Sandra J. Gallardo Elementary School, Sutter Middle School, and Folsom High School.
Ownership History
Date
Name
Owned For
Owner Type
Purchase Details
Closed on
Sep 26, 2019
Sold by
Graves Curley J and Graves Curley J
Bought by
Graves Eric
Current Estimated Value
Purchase Details
Closed on
Sep 18, 2019
Sold by
Graves Curley J and Graves Curley J
Bought by
Graves Curley J and Graves Curley J
Purchase Details
Closed on
Jan 20, 2004
Sold by
Graves Curley J and Graves Huguette B
Bought by
The Curley J & Huguette B Graves Revocab
Purchase Details
Closed on
Apr 5, 2000
Sold by
Lennar Renaissance Inc
Bought by
Graves Curley J and Graves Huguette B
Home Financials for this Owner
Home Financials are based on the most recent Mortgage that was taken out on this home.
Original Mortgage
$70,000
Interest Rate
8.24%
Create a Home Valuation Report for This Property
The Home Valuation Report is an in-depth analysis detailing your home's value as well as a comparison with similar homes in the area
Home Values in the Area
Average Home Value in this Area
Purchase History
| Date | Buyer | Sale Price | Title Company |
|---|---|---|---|
| Graves Eric | $200,000 | Allied T&E Svcs Inc | |
| Graves Eric | -- | Allied T&E Svcs Inc | |
| Graves Curley J | -- | None Available | |
| The Curley J & Huguette B Graves Revocab | -- | -- | |
| Graves Curley J | $272,000 | North American Title Guarant |
Source: Public Records
Mortgage History
| Date | Status | Borrower | Loan Amount |
|---|---|---|---|
| Previous Owner | Graves Curley J | $70,000 |
Source: Public Records
Tax History Compared to Growth
Tax History
| Year | Tax Paid | Tax Assessment Tax Assessment Total Assessment is a certain percentage of the fair market value that is determined by local assessors to be the total taxable value of land and additions on the property. | Land | Improvement |
|---|---|---|---|---|
| 2025 | $5,227 | $444,376 | $107,577 | $336,799 |
| 2024 | $5,227 | $435,664 | $105,468 | $330,196 |
| 2023 | $5,133 | $427,122 | $103,400 | $323,722 |
| 2022 | $5,046 | $418,748 | $101,373 | $317,375 |
| 2021 | $4,984 | $410,538 | $99,386 | $311,152 |
| 2020 | $4,614 | $406,329 | $98,367 | $307,962 |
| 2019 | $4,540 | $398,363 | $96,439 | $301,924 |
| 2018 | $4,431 | $390,553 | $94,549 | $296,004 |
| 2017 | $4,145 | $382,896 | $92,696 | $290,200 |
| 2016 | $4,320 | $375,389 | $90,879 | $284,510 |
| 2015 | $4,181 | $369,751 | $89,514 | $280,237 |
| 2014 | $3,978 | $362,509 | $87,761 | $274,748 |
Source: Public Records
Map
Nearby Homes
- 718 Hunter Place
- 920 Carter St
- 865 Hagen Ct
- 664 Cole Ct
- 380 Gardner Ct
- 170 Vierra Cir
- 968 Nichols Cir
- 104 Hesser Ct
- 692 Humbert St
- 121 Chesterfield Way
- 0 Figueroa St Unit 225034113
- 145 Hopfield Dr
- 103 Black Gold Ln
- 102 Black Gold Ln
- 100 Black Gold Ln
- 1038 Pintail Cir
- 931 Willow Bridge Dr
- 705 Diamond Glen Cir
- 408-408 1/2 Reading St
- 4110 Oakridge Ln