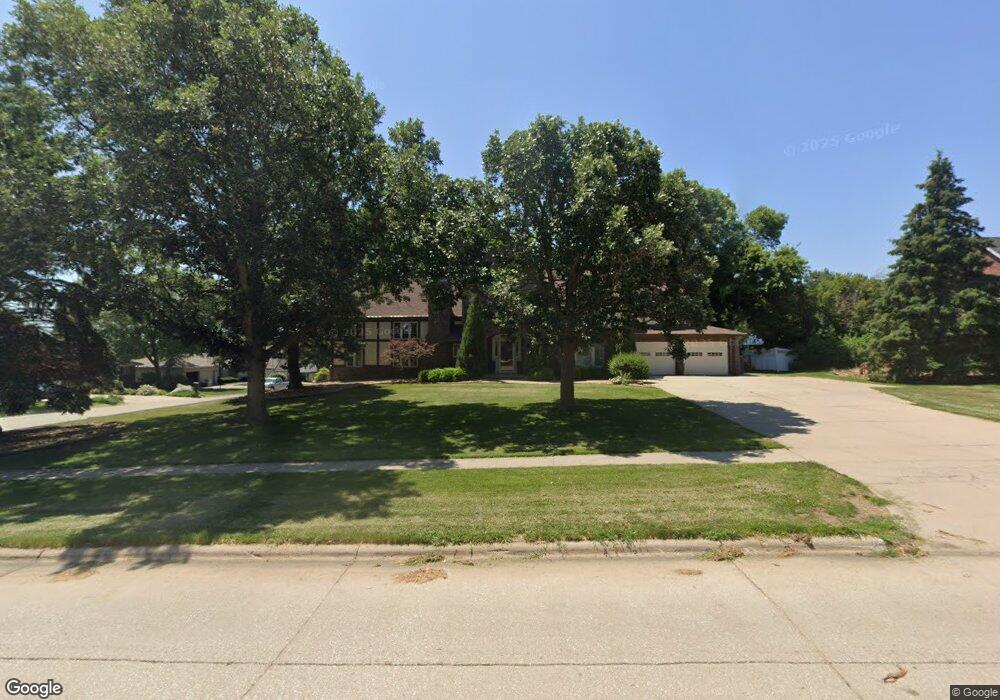
777 E Pinewood Ave Seward, NE 68434
Estimated Value: $722,226 - $801,000
5
Beds
4
Baths
3,812
Sq Ft
$201/Sq Ft
Est. Value
About This Home
This home is located at 777 E Pinewood Ave, Seward, NE 68434 and is currently estimated at $767,307, approximately $201 per square foot. 777 E Pinewood Ave is a home located in Seward County with nearby schools including Seward Elementary School, Seward Middle School, and Seward High School.
Ownership History
Date
Name
Owned For
Owner Type
Purchase Details
Closed on
Jul 11, 2025
Sold by
Holle Family Living Trust and Holle Jennifer Lynne
Bought by
Lewis Daniel J and Lewis Lorelii
Current Estimated Value
Home Financials for this Owner
Home Financials are based on the most recent Mortgage that was taken out on this home.
Original Mortgage
$350,000
Outstanding Balance
$348,517
Interest Rate
6.89%
Mortgage Type
New Conventional
Estimated Equity
$418,790
Purchase Details
Closed on
Sep 22, 2021
Sold by
Horacek Family Trust
Bought by
Fitzke Roger N and Fitzke Carrie A
Purchase Details
Closed on
Jun 10, 2021
Sold by
Fitzke Roger N and Fitzke Carrie A
Bought by
Holle Curtis M and Holle Jennifer L
Home Financials for this Owner
Home Financials are based on the most recent Mortgage that was taken out on this home.
Original Mortgage
$494,800
Interest Rate
2.9%
Mortgage Type
New Conventional
Create a Home Valuation Report for This Property
The Home Valuation Report is an in-depth analysis detailing your home's value as well as a comparison with similar homes in the area
Home Values in the Area
Average Home Value in this Area
Purchase History
| Date | Buyer | Sale Price | Title Company |
|---|---|---|---|
| Lewis Daniel J | $739,000 | Home Services Title | |
| Fitzke Roger N | $339,000 | Home Services Title | |
| Fitzke Roger N | $339,000 | Home Services Title | |
| Holle Curtis M | $619,000 | Title Svcs Of Blue Valley Ll |
Source: Public Records
Mortgage History
| Date | Status | Borrower | Loan Amount |
|---|---|---|---|
| Open | Lewis Daniel J | $350,000 | |
| Previous Owner | Holle Curtis M | $494,800 |
Source: Public Records
Tax History
| Year | Tax Paid | Tax Assessment Tax Assessment Total Assessment is a certain percentage of the fair market value that is determined by local assessors to be the total taxable value of land and additions on the property. | Land | Improvement |
|---|---|---|---|---|
| 2025 | $7,846 | $729,464 | $57,960 | $671,504 |
| 2024 | $8,159 | $724,004 | $52,500 | $671,504 |
| 2023 | $10,430 | $717,141 | $52,500 | $664,641 |
| 2022 | $10,278 | $638,641 | $52,500 | $586,141 |
| 2021 | $6,997 | $430,164 | $52,500 | $377,664 |
| 2020 | $7,087 | $430,164 | $52,500 | $377,664 |
| 2019 | $6,722 | $412,492 | $52,208 | $360,284 |
| 2018 | $6,437 | $399,231 | $48,512 | $350,719 |
| 2017 | $6,257 | $287,643 | $46,080 | $241,563 |
| 2016 | $5,926 | $365,037 | $46,202 | $318,835 |
| 2015 | $6,019 | $365,037 | $46,202 | $318,835 |
| 2013 | $4,950 | $267,052 | $39,640 | $227,412 |
Source: Public Records
Map
Nearby Homes
- 1811 N Columbia Ave
- 1052 Kolterman Ave
- 225 Knotty Pine Ln
- 265 Langworthy Ln
- 532 Church St
- 807 N 2nd St
- 1127 N 5th St
- 178 E Roberts St
- 1427 State Highway 15
- 1272 N 8th St
- 1325 N 8th St
- 328 N 1st St
- TBD N 8th St
- 410 N 3rd St
- 247 N 2nd St
- 149 N 1st St
- 000 Waverly Rd
- 406 N 7th St
- LOT 3 252 County Rd
- 507 Blazing Star Dr
- 733 E Pinewood Ave
- 1752 Karol Kay Blvd
- 1736 Karol Kay Blvd
- 1768 Karol Kay Blvd
- 1720 Karol Kay Blvd
- 1737 Eastridge Ave
- 1757 Eastridge Ave
- 1717 Eastridge Ave
- 1688 Karol Kay Blvd
- 1777 Edgewood Ln
- 711 E Pinewood Ave
- 1800 Karol Kay Blvd
- 1711 Edgewood Ln
- 770 E Pinewood Ave
- 1683 Eastridge Ave
- 1747 Edgewood Ln
- 740 E Pinewood Ave
- 1650 Karol Kay Blvd
- 1750 Eastridge Ave
- 1677 Edgewood Ln
Your Personal Tour Guide
Ask me questions while you tour the home.