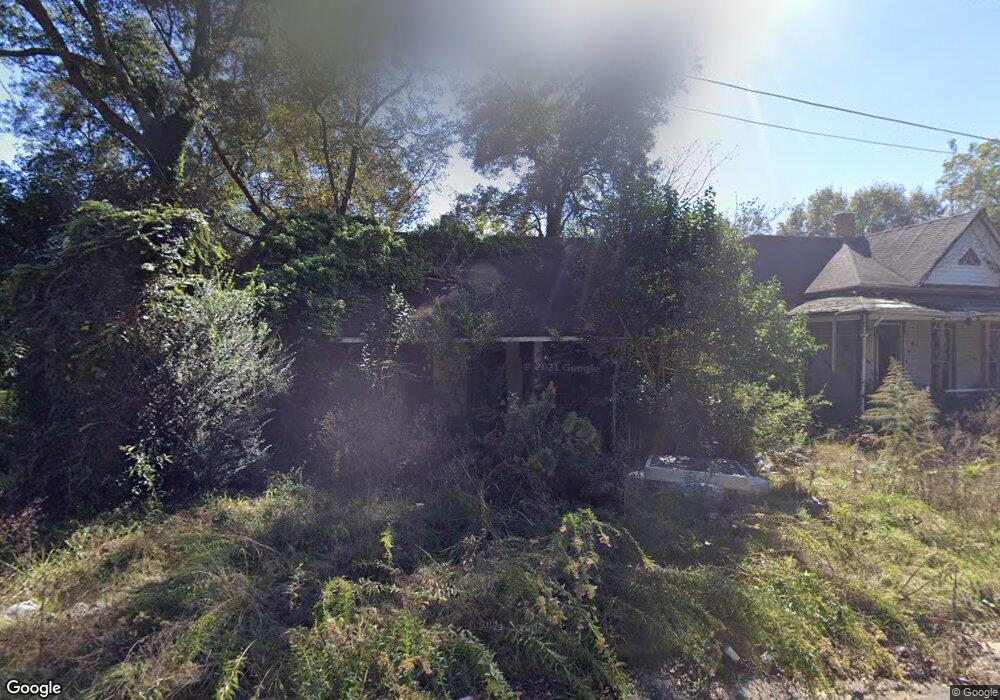
777 Peachtree St Macon, GA 31217
East Macon Historic District NeighborhoodEstimated Value: $34,000 - $78,000
3
Beds
1
Bath
1,072
Sq Ft
$54/Sq Ft
Est. Value
About This Home
This home is located at 777 Peachtree St, Macon, GA 31217 and is currently estimated at $57,865, approximately $53 per square foot. 777 Peachtree St is a home located in Bibb County with nearby schools including Burdell Elementary School, Appling Middle School, and Northeast High School.
Ownership History
Date
Name
Owned For
Owner Type
Purchase Details
Closed on
Dec 11, 2024
Sold by
Williams Joseph A and Mccord Samuel Wade
Bought by
Pfam Financial Group Llc
Current Estimated Value
Purchase Details
Closed on
Sep 2, 2022
Sold by
Williams Ruthie M
Bought by
Williams Joseph A
Purchase Details
Closed on
Feb 21, 2011
Sold by
Federal Home Loan Mortgage Corporation
Bought by
Williams Joseph
Purchase Details
Closed on
Sep 7, 2010
Sold by
Citimortgage Inc
Bought by
Federal Home Loan Mortgage Corp
Purchase Details
Closed on
Mar 10, 2006
Bought by
C M Invmt Properties Llc
Purchase Details
Closed on
Apr 13, 2005
Sold by
Prg Realty Llc
Bought by
Manzelli Mare A
Purchase Details
Closed on
Feb 24, 2005
Purchase Details
Closed on
May 16, 2003
Create a Home Valuation Report for This Property
The Home Valuation Report is an in-depth analysis detailing your home's value as well as a comparison with similar homes in the area
Home Values in the Area
Average Home Value in this Area
Purchase History
| Date | Buyer | Sale Price | Title Company |
|---|---|---|---|
| Pfam Financial Group Llc | $6,000 | None Listed On Document | |
| Pfam Financial Group Llc | $6,000 | None Listed On Document | |
| Williams Joseph A | -- | -- | |
| Williams Joseph | $2,000 | None Available | |
| Federal Home Loan Mortgage Corp | -- | None Available | |
| Citimortgage Inc | $43,149 | None Available | |
| C M Invmt Properties Llc | -- | -- | |
| Manzelli Mare A | $24,500 | None Available | |
| -- | $14,300 | -- | |
| Prg Realty Llc | $14,250 | None Available | |
| -- | $59,000 | -- |
Source: Public Records
Tax History Compared to Growth
Tax History
| Year | Tax Paid | Tax Assessment Tax Assessment Total Assessment is a certain percentage of the fair market value that is determined by local assessors to be the total taxable value of land and additions on the property. | Land | Improvement |
|---|---|---|---|---|
| 2025 | $70 | $2,860 | $2,860 | $0 |
| 2024 | $40 | $1,560 | $1,560 | $0 |
| 2023 | $83 | $2,785 | $1,300 | $1,485 |
| 2022 | $323 | $2,273 | $1,717 | $556 |
| 2021 | $532 | $3,380 | $644 | $2,736 |
| 2020 | $499 | $3,106 | $644 | $2,462 |
| 2019 | $111 | $2,833 | $644 | $2,189 |
| 2018 | $350 | $2,833 | $644 | $2,189 |
| 2017 | $106 | $2,833 | $644 | $2,189 |
| 2016 | $98 | $2,833 | $644 | $2,189 |
| 2015 | $139 | $2,833 | $644 | $2,189 |
| 2014 | $64 | $3,423 | $687 | $2,736 |
Source: Public Records
Map
Nearby Homes
- 807 Peachtree St
- 336 Fairview Ave
- 823 Applewood St
- 871 Peachtree St
- 789 Main St
- 242 Hydrolia St
- 506 Willingham Ct
- 508 Willingham Ct
- 521 Church St
- 866 Stewart St
- 1012 Emery Hwy
- 735 Maynard St
- 734 Fort Hill St
- 768 Maynard St
- 658 Pringle St
- 684 Reese St
- 760 Cowan St
- 747 Bowman St
- 769 Bowman St
- 774 Maynard St
- 763 Peachtree St
- 747 Peachtree St
- 768 Applewood St
- 782 Applewood St
- 756 Applewood St
- 250 Fairview Ave
- 731 Peachtree St
- 760 Peachtree St
- 790 Peachtree St
- 715 Peachtree St
- 675 Applewood St
- 736 Peachtree St
- 275 Fairview Ave
- 806 Peachtree St
- 255 Fairview Ave
- 261 Balkcom Ave
- 289 Balkcom Ave
- 324 Fairview Ave
- 724 Peachtree St
- 257 Balkcom Ave