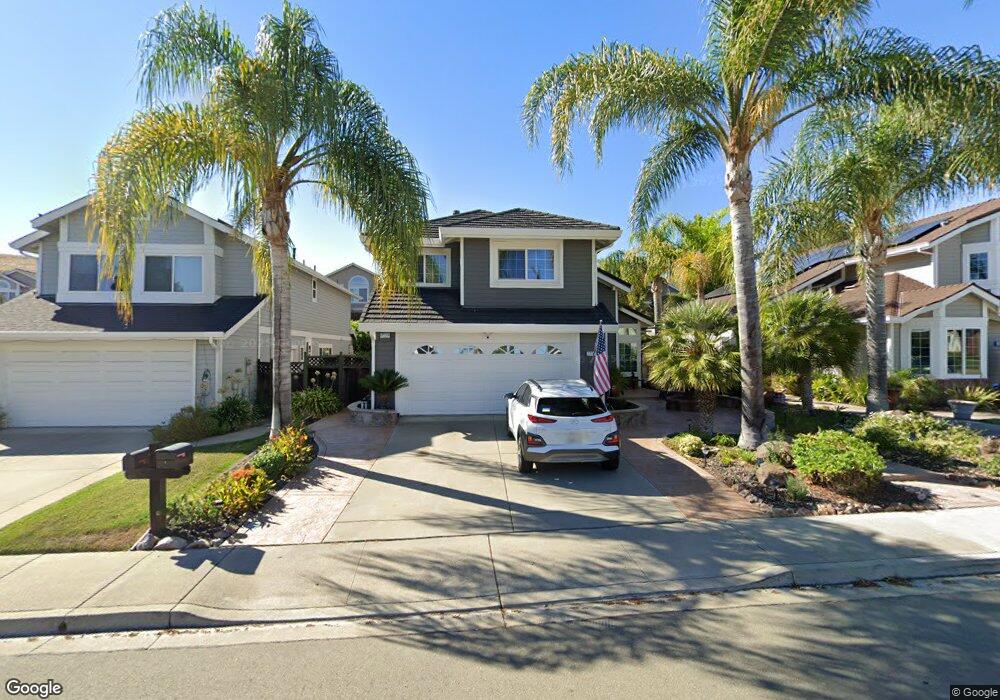
7774 Squirrel Creek Cir Dublin, CA 94568
Estimated Value: $1,649,443 - $1,837,000
4
Beds
3
Baths
2,040
Sq Ft
$849/Sq Ft
Est. Value
About This Home
This home is located at 7774 Squirrel Creek Cir, Dublin, CA 94568 and is currently estimated at $1,731,361, approximately $848 per square foot. 7774 Squirrel Creek Cir is a home located in Alameda County with nearby schools including Frederiksen Elementary School, Wells Middle School, and Dublin High School.
Ownership History
Date
Name
Owned For
Owner Type
Purchase Details
Closed on
Nov 22, 2013
Sold by
Covarelli Heidi M
Bought by
Covarelli August J
Current Estimated Value
Home Financials for this Owner
Home Financials are based on the most recent Mortgage that was taken out on this home.
Original Mortgage
$938,250
Interest Rate
2.41%
Mortgage Type
Reverse Mortgage Home Equity Conversion Mortgage
Purchase Details
Closed on
Mar 18, 2004
Sold by
Covarelli August John and Covarelli Heidi M
Bought by
Covarelli August J and Covarelli Heidi M
Purchase Details
Closed on
Apr 12, 2001
Sold by
Covarelli August John and Covarelli Heidi M
Bought by
Covarelli August J and Covarelli Heidi M
Home Financials for this Owner
Home Financials are based on the most recent Mortgage that was taken out on this home.
Original Mortgage
$274,950
Interest Rate
6.98%
Create a Home Valuation Report for This Property
The Home Valuation Report is an in-depth analysis detailing your home's value as well as a comparison with similar homes in the area
Home Values in the Area
Average Home Value in this Area
Purchase History
| Date | Buyer | Sale Price | Title Company |
|---|---|---|---|
| Covarelli August J | -- | Chicago Title Company | |
| Covarelli August J | -- | Chicago Title Company | |
| Covarelli August J | -- | -- | |
| Covarelli August J | -- | First California Title Compa |
Source: Public Records
Mortgage History
| Date | Status | Borrower | Loan Amount |
|---|---|---|---|
| Closed | Covarelli August J | $938,250 | |
| Closed | Covarelli August J | $274,950 |
Source: Public Records
Tax History Compared to Growth
Tax History
| Year | Tax Paid | Tax Assessment Tax Assessment Total Assessment is a certain percentage of the fair market value that is determined by local assessors to be the total taxable value of land and additions on the property. | Land | Improvement |
|---|---|---|---|---|
| 2025 | $6,569 | $411,273 | $167,947 | $250,326 |
| 2024 | $6,569 | $403,072 | $164,654 | $245,418 |
| 2023 | $6,487 | $402,032 | $161,426 | $240,606 |
| 2022 | $6,391 | $387,150 | $158,261 | $235,889 |
| 2021 | $6,268 | $379,422 | $155,158 | $231,264 |
| 2020 | $5,851 | $382,462 | $153,568 | $228,894 |
| 2019 | $5,788 | $374,963 | $150,557 | $224,406 |
| 2018 | $5,603 | $367,613 | $147,606 | $220,007 |
| 2017 | $5,568 | $360,406 | $144,712 | $215,694 |
| 2016 | $5,107 | $353,340 | $141,875 | $211,465 |
| 2015 | $4,937 | $348,033 | $139,744 | $208,289 |
| 2014 | $4,916 | $341,217 | $137,007 | $204,210 |
Source: Public Records
Map
Nearby Homes
- 7813 Shady Creek Rd
- 8043 Crossridge Rd
- 2141 Bent Creek Dr
- 6746 Sapphire St
- 7653 Turquoise St
- 9054 Craydon Cir
- 9048 Craydon Cir
- 9104 Craydon Cir
- 9014 Craydon Cir
- 7120 Cross Creek Cir Unit D
- 7092 N Mariposa Ct
- 7148 Dublin Meadows St Unit E
- 7063 Dublin Meadows St Unit H
- 8351 Mulberry Place
- 7054 Dublin Meadows St Unit D
- 6983 Alamo Creek Trail
- 1725 SW Wren
- 174 Dogwood Place
- 7020 Stagecoach Rd Unit A
- 6630 S Mariposa Ln
- 7762 Squirrel Creek Cir
- 7780 Squirrel Creek Cir
- 7786 Squirrel Creek Cir
- 7754 Squirrel Creek Cir
- 7799 Crossridge Rd
- 7787 Crossridge Rd
- 7811 Crossridge Rd
- 7790 Squirrel Creek Cir
- 7748 Squirrel Creek Cir
- 7823 Crossridge Rd
- 7763 Squirrel Creek Cir
- 7775 Squirrel Creek Cir
- 7755 Squirrel Creek Cir
- 7763 Crossridge Rd
- 7781 Squirrel Creek Cir
- 7835 Crossridge Rd
- 7746 Squirrel Creek Cir
- 7794 Squirrel Creek Cir
- 7751 Crossridge Rd
- 7787 Squirrel Creek Cir