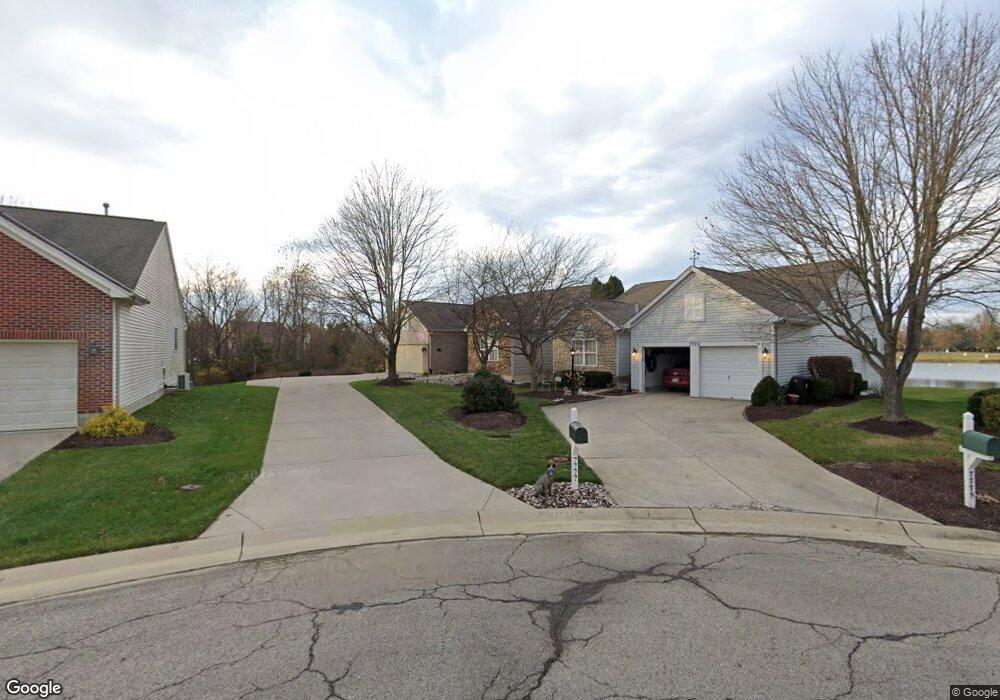
7777 Swan Song Cir Maineville, OH 45039
Hamilton Township NeighborhoodEstimated Value: $399,000 - $420,450
3
Beds
3
Baths
1,798
Sq Ft
$227/Sq Ft
Est. Value
About This Home
This home is located at 7777 Swan Song Cir, Maineville, OH 45039 and is currently estimated at $408,363, approximately $227 per square foot. 7777 Swan Song Cir is a home located in Warren County with nearby schools including Little Miami High School.
Ownership History
Date
Name
Owned For
Owner Type
Purchase Details
Closed on
Feb 13, 2004
Sold by
Czerwonka Properties Llc
Bought by
Hubbard Leon and Hubbard Marilouise
Current Estimated Value
Purchase Details
Closed on
Nov 30, 1999
Sold by
R & R Assoc
Bought by
Hubbvard Leon Marilouise
Home Financials for this Owner
Home Financials are based on the most recent Mortgage that was taken out on this home.
Original Mortgage
$252,700
Interest Rate
7.9%
Mortgage Type
New Conventional
Purchase Details
Closed on
Mar 19, 1999
Sold by
Village On The Green Ltd
Bought by
R & R Assoc
Home Financials for this Owner
Home Financials are based on the most recent Mortgage that was taken out on this home.
Original Mortgage
$150,000
Interest Rate
6.8%
Mortgage Type
New Conventional
Create a Home Valuation Report for This Property
The Home Valuation Report is an in-depth analysis detailing your home's value as well as a comparison with similar homes in the area
Home Values in the Area
Average Home Value in this Area
Purchase History
| Date | Buyer | Sale Price | Title Company |
|---|---|---|---|
| Hubbard Leon | -- | -- | |
| Hubbvard Leon Marilouise | $266,663 | -- | |
| R & R Assoc | $154,500 | -- |
Source: Public Records
Mortgage History
| Date | Status | Borrower | Loan Amount |
|---|---|---|---|
| Previous Owner | Hubbvard Leon Marilouise | $252,700 | |
| Previous Owner | R & R Assoc | $150,000 |
Source: Public Records
Tax History Compared to Growth
Tax History
| Year | Tax Paid | Tax Assessment Tax Assessment Total Assessment is a certain percentage of the fair market value that is determined by local assessors to be the total taxable value of land and additions on the property. | Land | Improvement |
|---|---|---|---|---|
| 2024 | $5,832 | $130,420 | $26,250 | $104,170 |
| 2023 | $5,558 | $111,009 | $21,000 | $90,009 |
| 2022 | $5,495 | $111,010 | $21,000 | $90,010 |
| 2021 | $5,239 | $111,010 | $21,000 | $90,010 |
| 2020 | $5,116 | $92,509 | $17,500 | $75,009 |
| 2019 | $5,200 | $92,509 | $17,500 | $75,009 |
| 2018 | $5,039 | $92,509 | $17,500 | $75,009 |
| 2017 | $4,297 | $78,316 | $15,712 | $62,605 |
| 2016 | $4,399 | $78,316 | $15,712 | $62,605 |
| 2015 | $4,395 | $78,316 | $15,712 | $62,605 |
| 2014 | $4,734 | $74,590 | $14,960 | $59,620 |
| 2013 | $4,605 | $87,230 | $17,500 | $69,730 |
Source: Public Records
Map
Nearby Homes
- 1058 Wood Duck Ct
- 935 Pine Needle Place
- 7710 Crystal Cove Pointe
- 7797 Wilderness Way
- 7829 Wilderness Way
- 7638 Lake Pointe
- 1247 Eagle Blvd
- 1255 Eagle Blvd
- 7873 Ellington Ct
- 7699 Turtle Hollow
- 7569 Macaulay Blvd
- 1050 E Fosters Maineville Rd
- 1440 Eagle Blvd
- 1527 Englewood Ct
- 1378 Huntwick Ln
- 1334 E Foster-Maineville Rd
- 0 Zoar Rd Unit 934288
- 0 Zoar Rd Unit 1832052
- 1538 Wexler Ct
- 1577 Kilbarron Dr
- 7775 Swan Song Cir
- 7781 Swansong Cir
- 7781 Swan Song Cir
- 7770 Swansong Cir
- 7770 Swan Song Cir
- 7774 Swan Song Cir
- 7795 Swan Song Cir
- 7774 Swansong Cir
- 7778 Swan Song Cir
- 7780 Swan Song Cir
- 7794 Swan Song Cir
- 7784 Crystal Lake Ln
- 7807 Swan Song Cir
- 7772 Crystal Lake Ln
- 7762 Crystal Lake Ln
- 7794 Crystal Lake Ln
- 7750 Crystal Lake Ln
- 7853 Crystal Cove Pointe
- 7740 Crystal Lake Ln
- 7853 Crystal Cove Point