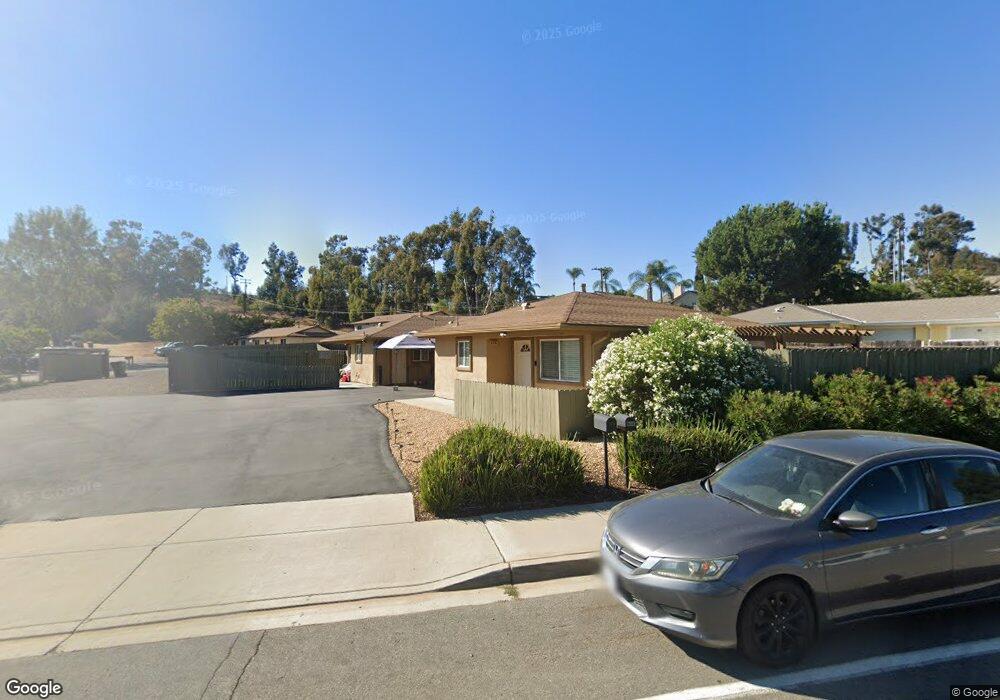
778 Vineyard Rd Unit 80 San Marcos, CA 92069
Estimated Value: $857,318 - $1,016,000
4
Beds
2
Baths
1,628
Sq Ft
$559/Sq Ft
Est. Value
About This Home
This home is located at 778 Vineyard Rd Unit 80, San Marcos, CA 92069 and is currently estimated at $910,773, approximately $559 per square foot. 778 Vineyard Rd Unit 80 is a home located in San Diego County with nearby schools including Twin Oaks Elementary School, Woodland Park Middle School, and Mission Hills High School.
Ownership History
Date
Name
Owned For
Owner Type
Purchase Details
Closed on
Mar 26, 2013
Sold by
Williamson Kevin D
Bought by
Williamson Kevin
Current Estimated Value
Purchase Details
Closed on
Oct 5, 1984
Create a Home Valuation Report for This Property
The Home Valuation Report is an in-depth analysis detailing your home's value as well as a comparison with similar homes in the area
Home Values in the Area
Average Home Value in this Area
Purchase History
| Date | Buyer | Sale Price | Title Company |
|---|---|---|---|
| Williamson Kevin | -- | None Available | |
| -- | $99,700 | -- |
Source: Public Records
Tax History Compared to Growth
Tax History
| Year | Tax Paid | Tax Assessment Tax Assessment Total Assessment is a certain percentage of the fair market value that is determined by local assessors to be the total taxable value of land and additions on the property. | Land | Improvement |
|---|---|---|---|---|
| 2025 | $2,233 | $203,080 | $59,483 | $143,597 |
| 2024 | $2,233 | $199,099 | $58,317 | $140,782 |
| 2023 | $2,191 | $195,196 | $57,174 | $138,022 |
| 2022 | $2,161 | $191,369 | $56,053 | $135,316 |
| 2021 | $2,126 | $187,617 | $54,954 | $132,663 |
| 2020 | $2,106 | $185,694 | $54,391 | $131,303 |
| 2019 | $2,083 | $182,054 | $53,325 | $128,729 |
| 2018 | $2,017 | $178,485 | $52,280 | $126,205 |
| 2017 | $133 | $174,986 | $51,255 | $123,731 |
| 2016 | $1,946 | $171,555 | $50,250 | $121,305 |
| 2015 | $1,918 | $168,979 | $49,496 | $119,483 |
| 2014 | $1,875 | $165,670 | $48,527 | $117,143 |
Source: Public Records
Map
Nearby Homes
- 823 Orla St
- 460 Chardonnay Ct
- 734 Brass Lantern Rd
- 908 Lantana Ct
- 516 Moonlight Dr
- 560 Moonlight Dr
- 320 Crownview Ct
- 1221 Gable Ct
- 1320 Richland Rd
- 909 Richland Rd Unit 14
- 909 Richland Rd Unit 79
- 909 Richland Rd Unit 50
- 1204 Gable Ct
- 971 Borden Rd Unit 18
- 971 Borden Rd Unit 75
- 303 Mission Villas Rd
- 1366 Topanga Dr
- 500 Rancheros Dr Unit 191
- 500 Rancheros Dr Unit 181
- 500 Rancheros Dr Unit 58
- 791 N Alda Dr
- 782-84 Vineyard Rd
- 784 Vineyard Rd
- 782 Vineyard Rd Unit 782
- 782 Vineyard Rd
- 786 N Alda Dr Unit 88
- 760 Vineyard Rd Unit 62
- 700 Teakwood Ct
- 773 N Alda Dr Unit 85
- 790 Vineyard Rd
- 713 Teakwood Ct
- 776 N Alda Dr
- 701 Teakwood Ct
- 701 Ivywood Ct
- 685 Dane Dr
- 687 Dane Dr
- 790 Maple Ave
- 683 Dane Dr
- 689 Dane Dr
- 795 Maple Ave