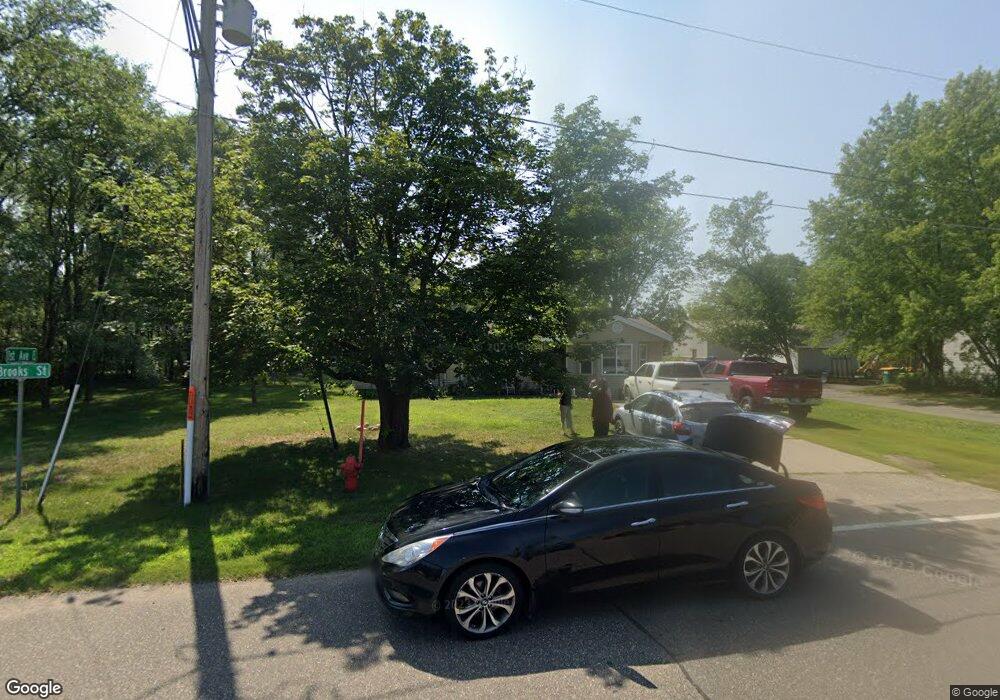
7781 Brooks St Clear Lake, MN 55319
Estimated Value: $222,000 - $298,000
2
Beds
2
Baths
1,298
Sq Ft
$209/Sq Ft
Est. Value
About This Home
This home is located at 7781 Brooks St, Clear Lake, MN 55319 and is currently estimated at $271,163, approximately $208 per square foot. 7781 Brooks St is a home located in Sherburne County with nearby schools including Clearview Elementary School and South Junior High School.
Ownership History
Date
Name
Owned For
Owner Type
Purchase Details
Closed on
Mar 23, 2018
Sold by
Baumgarter Mark
Bought by
Berry Bobbi J
Current Estimated Value
Home Financials for this Owner
Home Financials are based on the most recent Mortgage that was taken out on this home.
Original Mortgage
$137,373
Outstanding Balance
$117,773
Interest Rate
4.4%
Mortgage Type
New Conventional
Estimated Equity
$153,390
Purchase Details
Closed on
Jun 5, 1996
Sold by
Abraham Leroy T
Bought by
Baumgartner Mark J
Create a Home Valuation Report for This Property
The Home Valuation Report is an in-depth analysis detailing your home's value as well as a comparison with similar homes in the area
Home Values in the Area
Average Home Value in this Area
Purchase History
| Date | Buyer | Sale Price | Title Company |
|---|---|---|---|
| Berry Bobbi J | $136,000 | First American Title | |
| Baumgartner Mark J | $64,900 | -- |
Source: Public Records
Mortgage History
| Date | Status | Borrower | Loan Amount |
|---|---|---|---|
| Open | Berry Bobbi J | $137,373 |
Source: Public Records
Tax History Compared to Growth
Tax History
| Year | Tax Paid | Tax Assessment Tax Assessment Total Assessment is a certain percentage of the fair market value that is determined by local assessors to be the total taxable value of land and additions on the property. | Land | Improvement |
|---|---|---|---|---|
| 2025 | $2,420 | $247,900 | $80,200 | $167,700 |
| 2024 | $2,482 | $236,600 | $74,000 | $162,600 |
| 2023 | $2,398 | $233,900 | $74,000 | $159,900 |
| 2022 | $2,190 | $211,600 | $60,200 | $151,400 |
| 2020 | $1,858 | $154,100 | $28,300 | $125,800 |
| 2019 | $1,738 | $140,300 | $28,300 | $112,000 |
| 2018 | $1,676 | $128,300 | $25,400 | $102,900 |
| 2017 | $1,610 | $120,700 | $25,400 | $95,300 |
| 2016 | $1,470 | $114,800 | $24,300 | $90,500 |
| 2015 | $1,404 | $83,500 | $18,300 | $65,200 |
| 2014 | $1,346 | $77,500 | $17,300 | $60,200 |
| 2013 | -- | $73,900 | $17,000 | $56,900 |
Source: Public Records
Map
Nearby Homes