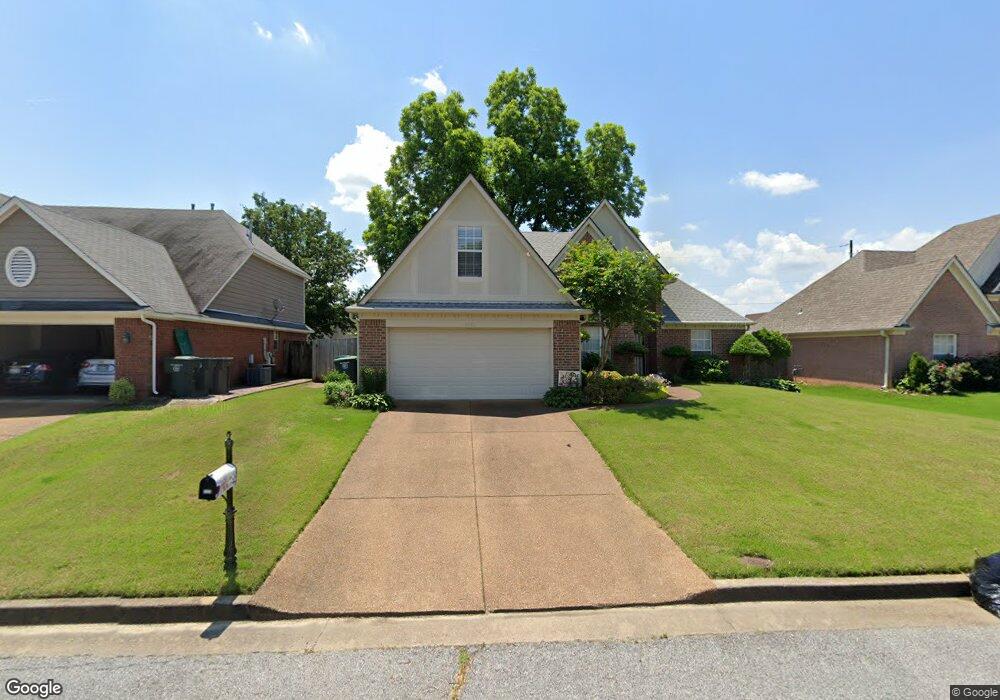
7783 Redfearn Cir N Memphis, TN 38133
Estimated Value: $221,000 - $272,666
4
Beds
2
Baths
2,276
Sq Ft
$109/Sq Ft
Est. Value
About This Home
This home is located at 7783 Redfearn Cir N, Memphis, TN 38133 and is currently estimated at $248,667, approximately $109 per square foot. 7783 Redfearn Cir N is a home located in Shelby County with nearby schools including Kate Bond Elementary School, Kate Bond Middle School, and Cordova High School.
Ownership History
Date
Name
Owned For
Owner Type
Purchase Details
Closed on
Jun 1, 2022
Sold by
Stump Luz G and Stump Raymond Dale
Bought by
Rogers Bruce and Rogers Carmelita E
Current Estimated Value
Home Financials for this Owner
Home Financials are based on the most recent Mortgage that was taken out on this home.
Original Mortgage
$246,000
Outstanding Balance
$233,720
Interest Rate
5.1%
Mortgage Type
VA
Estimated Equity
$14,947
Purchase Details
Closed on
Nov 22, 2017
Sold by
Stump Luz G
Bought by
Stump Luz G and Stump Dale Raymond
Purchase Details
Closed on
Dec 3, 2003
Sold by
Piwonka Bruce E
Bought by
Piwonka Luz G
Purchase Details
Closed on
Aug 11, 1999
Sold by
Sovereign Builders Llc
Bought by
Piwonka Bruce E and Piwonka Lux G
Home Financials for this Owner
Home Financials are based on the most recent Mortgage that was taken out on this home.
Original Mortgage
$125,550
Interest Rate
7.65%
Purchase Details
Closed on
Feb 20, 1998
Sold by
Country Club Homes Inc
Bought by
Morgan Peggy D
Home Financials for this Owner
Home Financials are based on the most recent Mortgage that was taken out on this home.
Original Mortgage
$48,480
Interest Rate
6.89%
Create a Home Valuation Report for This Property
The Home Valuation Report is an in-depth analysis detailing your home's value as well as a comparison with similar homes in the area
Home Values in the Area
Average Home Value in this Area
Purchase History
| Date | Buyer | Sale Price | Title Company |
|---|---|---|---|
| Rogers Bruce | $260,000 | Griffin Clift Everton And Masc | |
| Stump Luz G | -- | None Available | |
| Piwonka Luz G | -- | -- | |
| Piwonka Bruce E | $156,980 | -- | |
| Morgan Peggy D | $60,000 | Southern Escrow Title Compan |
Source: Public Records
Mortgage History
| Date | Status | Borrower | Loan Amount |
|---|---|---|---|
| Open | Rogers Bruce | $246,000 | |
| Previous Owner | Piwonka Bruce E | $125,550 | |
| Previous Owner | Morgan Peggy D | $48,480 |
Source: Public Records
Tax History Compared to Growth
Tax History
| Year | Tax Paid | Tax Assessment Tax Assessment Total Assessment is a certain percentage of the fair market value that is determined by local assessors to be the total taxable value of land and additions on the property. | Land | Improvement |
|---|---|---|---|---|
| 2025 | $1,663 | $74,000 | $8,750 | $65,250 |
| 2024 | $1,663 | $49,050 | $6,125 | $42,925 |
| 2023 | $2,988 | $49,050 | $6,125 | $42,925 |
| 2022 | $2,988 | $49,050 | $6,125 | $42,925 |
| 2021 | $1,692 | $49,050 | $6,125 | $42,925 |
| 2020 | $175 | $37,525 | $6,125 | $31,400 |
| 2019 | $1,199 | $37,525 | $6,125 | $31,400 |
| 2018 | $1,199 | $37,525 | $6,125 | $31,400 |
| 2017 | $1,228 | $37,525 | $6,125 | $31,400 |
| 2016 | $1,468 | $33,600 | $0 | $0 |
| 2014 | $1,468 | $33,600 | $0 | $0 |
Source: Public Records
Map
Nearby Homes
- 7828 Deerfield Trace
- 2718 Kate Bond Rd
- 7685 Crystal Brook Cove
- 2412 Kate Bond Rd
- 7723 Reese Rd
- 7551 Meadowland Dr
- 2554 Appling Glen Dr
- 2566 Austin Green Bay
- 2376 Pate Rd
- 2789 Arbor Lane Dr
- 2739 Lakeside Dr
- 7374 U S Highway 64
- 6898 Talcott Ln
- 6878 Johnstown Ln
- 3116 Mannington Ln
- BERRYHILL Rd
- 2518 Bassfield Dr
- 2633 Sleepy Bend Cove
- 2065 Steeplebrook Dr
- 7183 Polder Dr
- 7793 Redfearn Cir N
- 7775 Redfearn Cir N
- 7780 Redfearn Cir S
- 7774 Redfearn Cir S
- 7790 Redfearn Cir S
- 7757 Redfearn Cir N
- 7778 Redfearn Cir N
- 7786 Redfearn Cir N
- 2631 Kate Bond Rd
- 2625 Kate Bond Rd
- 7758 Redfearn Cir S
- 7772 Redfearn Cir N
- 7796 Redfearn Cir N
- 7800 Redfearn Cir S
- 7766 Redfearn Cir N
- 7802 Redfearn Cir N
- 7742 Redfearn Cir N
- 7785 Redfearn Cir S
- 7748 Redfearn Cir N
- 7777 Redfearn Cir S