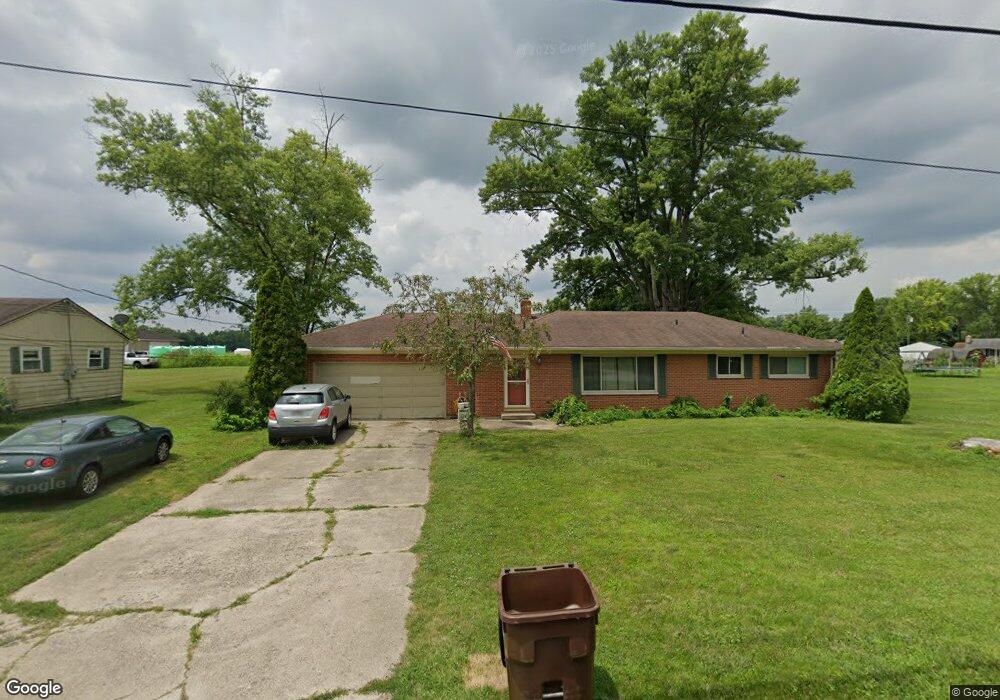
7787 Martz Paulin Rd Franklin, OH 45005
Estimated Value: $191,000 - $250,000
3
Beds
1
Bath
1,248
Sq Ft
$178/Sq Ft
Est. Value
About This Home
This home is located at 7787 Martz Paulin Rd, Franklin, OH 45005 and is currently estimated at $222,334, approximately $178 per square foot. 7787 Martz Paulin Rd is a home located in Warren County with nearby schools including Alden R Brown Elementary School, Chamberlain Middle School, and Carlisle High School.
Ownership History
Date
Name
Owned For
Owner Type
Purchase Details
Closed on
Feb 28, 2005
Sold by
Bell Jennifer N and Bell Charles Larry
Bought by
Brooks Vernon R and Brooks Kristine A
Current Estimated Value
Home Financials for this Owner
Home Financials are based on the most recent Mortgage that was taken out on this home.
Original Mortgage
$110,000
Outstanding Balance
$62,226
Interest Rate
7.4%
Mortgage Type
Purchase Money Mortgage
Estimated Equity
$160,108
Purchase Details
Closed on
Jun 19, 1998
Sold by
Gilbert Angela J
Bought by
Bell Jennifer N and Bell Charles Larry
Home Financials for this Owner
Home Financials are based on the most recent Mortgage that was taken out on this home.
Original Mortgage
$94,939
Interest Rate
7.22%
Mortgage Type
FHA
Purchase Details
Closed on
Jul 3, 1991
Sold by
Bishop Anna Mary and Anna Mary
Bought by
Anna Bishop and Anna Mary
Create a Home Valuation Report for This Property
The Home Valuation Report is an in-depth analysis detailing your home's value as well as a comparison with similar homes in the area
Home Values in the Area
Average Home Value in this Area
Purchase History
| Date | Buyer | Sale Price | Title Company |
|---|---|---|---|
| Brooks Vernon R | $110,000 | Republic Title Agency Inc | |
| Bell Jennifer N | $94,830 | -- | |
| Anna Bishop | -- | -- |
Source: Public Records
Mortgage History
| Date | Status | Borrower | Loan Amount |
|---|---|---|---|
| Open | Brooks Vernon R | $110,000 | |
| Previous Owner | Bell Jennifer N | $94,939 |
Source: Public Records
Tax History Compared to Growth
Tax History
| Year | Tax Paid | Tax Assessment Tax Assessment Total Assessment is a certain percentage of the fair market value that is determined by local assessors to be the total taxable value of land and additions on the property. | Land | Improvement |
|---|---|---|---|---|
| 2024 | $1,932 | $49,910 | $15,130 | $34,780 |
| 2023 | $1,568 | $37,394 | $7,759 | $29,634 |
| 2022 | $1,560 | $37,394 | $7,760 | $29,635 |
| 2021 | $1,506 | $37,394 | $7,760 | $29,635 |
| 2020 | $1,461 | $31,689 | $6,577 | $25,113 |
| 2019 | $1,480 | $31,689 | $6,577 | $25,113 |
| 2018 | $1,450 | $31,689 | $6,577 | $25,113 |
| 2017 | $1,541 | $30,527 | $5,443 | $25,085 |
| 2016 | $1,343 | $30,527 | $5,443 | $25,085 |
| 2015 | $1,346 | $30,527 | $5,443 | $25,085 |
| 2014 | $1,327 | $30,530 | $5,440 | $25,080 |
| 2013 | $1,322 | $36,880 | $6,580 | $30,300 |
Source: Public Records
Map
Nearby Homes
- 8211 Sue Ave
- 7368 Timber Wolf Dr
- 7836 Timberwind Trail
- 7885 Timberview Ct
- 7877 Timberview Ct
- 7286 Timber Wolf Dr
- 1033 Poinciana Dr
- 7510 Ned Ct
- 1225 Waterbury Dr
- 8676 Sweetbriar Ct
- 701 Easter Dr
- 7150 Country Walk Dr
- 7461 Skylark Cir
- 7403 Brookstone Dr
- 85 Timber Creek Dr
- 7103 Country Walk Dr
- 90 Timber Creek Dr
- 7311 Beth Ct
- 1223 Waterbury Dr
- 1215 Waterbury Dr
- 7769 Martz Paulin Rd
- 7823 Martz Paulin Rd
- 7823 Matz Paulin Rd
- 7757 Martz Paulin Rd
- 7788 Martz Paulin Rd
- 8059 Sharon Ct
- 7816 Martz Paulin Rd
- 7770 Martz Paulin Rd
- 8091 Sharon Ct
- 7731 Martz Paulin Rd
- 7824 Martz Paulin Rd
- 7754 Martz Paulin Rd
- 7861 Martz Paulin Rd
- 7846 Martz Paulin Rd
- 7711 Martz Paulin Rd
- 8100 Sharon Ct
- 7726 Martz Paulin Rd
- 7946 Lowe Dr
- 8066 Sharon Ct
- 7787 Anne Dr