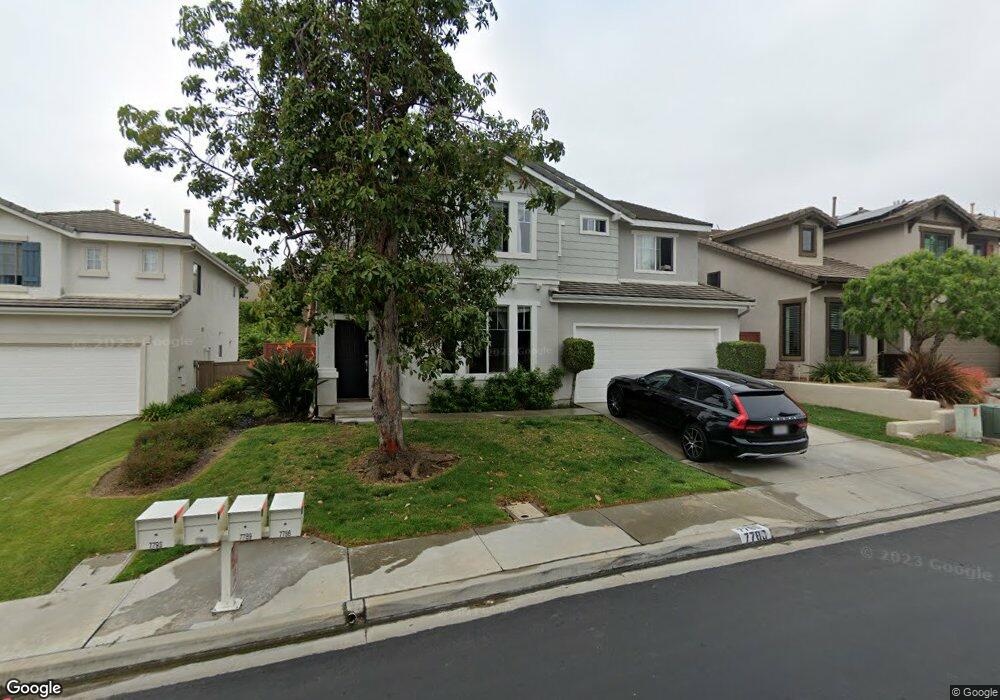
7789 Calle Mejor Carlsbad, CA 92009
La Costa NeighborhoodEstimated Value: $1,596,000 - $1,864,000
4
Beds
3
Baths
2,217
Sq Ft
$761/Sq Ft
Est. Value
About This Home
This home is located at 7789 Calle Mejor, Carlsbad, CA 92009 and is currently estimated at $1,687,709, approximately $761 per square foot. 7789 Calle Mejor is a home located in San Diego County with nearby schools including Mission Estancia Elementary School, Diegueno Middle School, and La Costa Canyon High School.
Ownership History
Date
Name
Owned For
Owner Type
Purchase Details
Closed on
Sep 22, 2003
Sold by
Cook Michael E and Cook Lori
Bought by
Cook Michael E and Cook Lori
Current Estimated Value
Purchase Details
Closed on
Jul 7, 2003
Sold by
Cook Michael E and Cook Lori
Bought by
Cook Michael E and Cook Lori
Home Financials for this Owner
Home Financials are based on the most recent Mortgage that was taken out on this home.
Original Mortgage
$123,400
Outstanding Balance
$52,305
Interest Rate
5.22%
Mortgage Type
Unknown
Estimated Equity
$1,635,404
Purchase Details
Closed on
Mar 26, 1998
Sold by
Cook Michael E and Cook Lori
Bought by
Cook Michael E and Cook Lori
Purchase Details
Closed on
Oct 10, 1997
Sold by
Greystone Homes Inc
Bought by
Cook Michael E and Cook Lori
Home Financials for this Owner
Home Financials are based on the most recent Mortgage that was taken out on this home.
Original Mortgage
$127,900
Interest Rate
7.14%
Create a Home Valuation Report for This Property
The Home Valuation Report is an in-depth analysis detailing your home's value as well as a comparison with similar homes in the area
Home Values in the Area
Average Home Value in this Area
Purchase History
| Date | Buyer | Sale Price | Title Company |
|---|---|---|---|
| Cook Michael E | -- | -- | |
| Cook Michael E | -- | Commerce Title Company | |
| Cook Michael E | -- | -- | |
| Cook Michael E | $272,500 | First American Title |
Source: Public Records
Mortgage History
| Date | Status | Borrower | Loan Amount |
|---|---|---|---|
| Open | Cook Michael E | $123,400 | |
| Previous Owner | Cook Michael E | $127,900 |
Source: Public Records
Tax History Compared to Growth
Tax History
| Year | Tax Paid | Tax Assessment Tax Assessment Total Assessment is a certain percentage of the fair market value that is determined by local assessors to be the total taxable value of land and additions on the property. | Land | Improvement |
|---|---|---|---|---|
| 2025 | $5,910 | $434,614 | $143,697 | $290,917 |
| 2024 | $5,910 | $426,093 | $140,880 | $285,213 |
| 2023 | $5,747 | $417,739 | $138,118 | $279,621 |
| 2022 | $5,617 | $409,549 | $135,410 | $274,139 |
| 2021 | $5,525 | $401,519 | $132,755 | $268,764 |
| 2020 | $5,438 | $397,403 | $131,394 | $266,009 |
| 2019 | $5,350 | $389,612 | $128,818 | $260,794 |
| 2018 | $5,280 | $381,974 | $126,293 | $255,681 |
| 2017 | $5,206 | $374,485 | $123,817 | $250,668 |
| 2016 | $5,076 | $367,143 | $121,390 | $245,753 |
| 2015 | $4,991 | $361,629 | $119,567 | $242,062 |
| 2014 | $4,886 | $354,546 | $117,225 | $237,321 |
Source: Public Records
Map
Nearby Homes
- 3101 Levante St
- 7702 Caminito Tingo Unit H203
- Kestrel - Plan 4 at The Nest at La Costa
- Robin - Plan 3 at The Nest at La Costa
- Lark - Plan 1 at The Nest at La Costa
- Wren - Plan 2 at The Nest at La Costa
- Starling - Plan 5 at The Nest at La Costa
- 3008 Garboso St
- 3514 Sitio Baya
- 7911 Terraza Disoma
- 3356 Corte Tiburon
- 8010 Calle Pinon
- 7925 Calle Madrid
- 3109 Madera Ct
- 7523 Quinta St
- 7941 Calle Madrid Unit 4
- 3112 Del Rey Ave
- 0000 Cadencia St Between 7402-7412 Unit 474
- 3240 Piragua St
- 7310 Esfera St
- 7785 Calle Mejor
- 7793 Calle Mejor
- 7781 Calle Mejor
- 7786 Calle Mejor
- 7782 Calle Mejor
- 7801 Calle Mejor
- 7777 Calle Mejor
- 7790 Calle Mejor
- 7778 Calle Mejor
- 7774 Calle Mejor
- 7803 Calle Mejor
- 7773 Calle Mejor
- 7794 Calle Mejor
- 7783 Corte Promenade
- 7770 Calle Mejor
- 7805 Calle Mejor
- 7824 Quebrada Cir
- 7798 Calle Mejor
- 7767 Calle Mejor
- 7822 Quebrada Cir