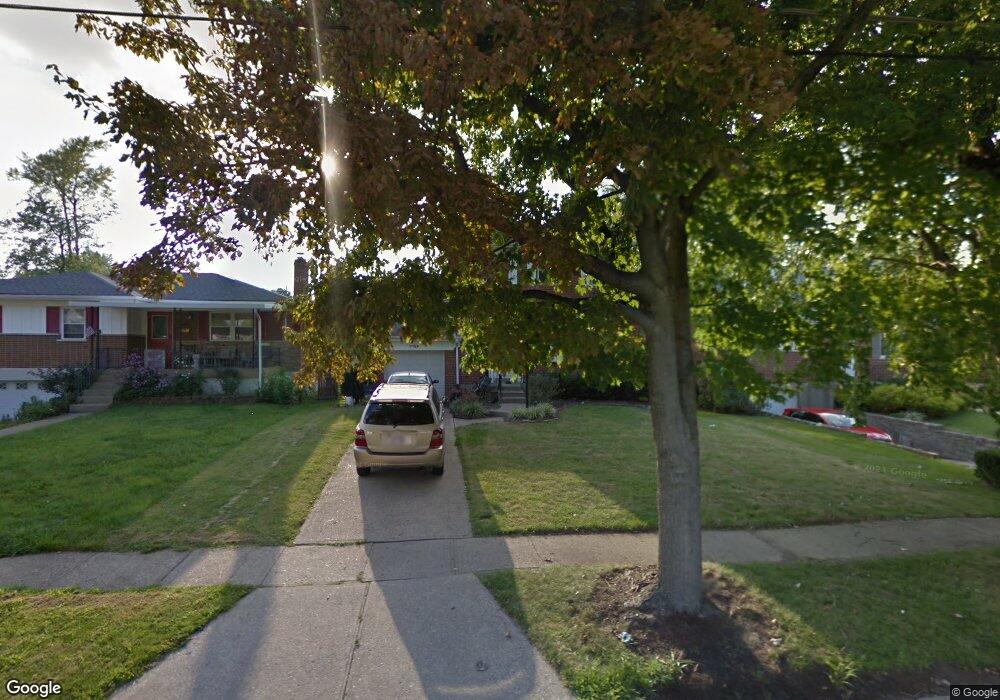
7789 Spirea Dr Cincinnati, OH 45236
Estimated Value: $282,000 - $359,000
3
Beds
2
Baths
1,350
Sq Ft
$244/Sq Ft
Est. Value
About This Home
This home is located at 7789 Spirea Dr, Cincinnati, OH 45236 and is currently estimated at $329,301, approximately $243 per square foot. 7789 Spirea Dr is a home located in Hamilton County with nearby schools including Amity Elementary School, Deer Park Jr/Sr High School, and St. Vincent Ferrer Catholic School.
Ownership History
Date
Name
Owned For
Owner Type
Purchase Details
Closed on
May 6, 2005
Sold by
Kressler Adam D and Kressler Tara S
Bought by
Pheng Leng
Current Estimated Value
Home Financials for this Owner
Home Financials are based on the most recent Mortgage that was taken out on this home.
Original Mortgage
$157,500
Interest Rate
5.8%
Mortgage Type
Fannie Mae Freddie Mac
Purchase Details
Closed on
Sep 3, 1999
Sold by
Webster Paul S
Bought by
Kressler Adam D and Kressler Tara S
Home Financials for this Owner
Home Financials are based on the most recent Mortgage that was taken out on this home.
Original Mortgage
$113,600
Interest Rate
7.77%
Mortgage Type
Balloon
Purchase Details
Closed on
Jan 2, 1997
Sold by
Lake Thomas L and Lake Jane R
Bought by
Webster Paul S
Home Financials for this Owner
Home Financials are based on the most recent Mortgage that was taken out on this home.
Original Mortgage
$82,000
Interest Rate
7.6%
Create a Home Valuation Report for This Property
The Home Valuation Report is an in-depth analysis detailing your home's value as well as a comparison with similar homes in the area
Home Values in the Area
Average Home Value in this Area
Purchase History
| Date | Buyer | Sale Price | Title Company |
|---|---|---|---|
| Pheng Leng | -- | None Available | |
| Kressler Adam D | $142,000 | Great Midwest Title Agency I | |
| Webster Paul S | $122,500 | -- |
Source: Public Records
Mortgage History
| Date | Status | Borrower | Loan Amount |
|---|---|---|---|
| Previous Owner | Pheng Leng | $157,500 | |
| Previous Owner | Kressler Adam D | $113,600 | |
| Previous Owner | Webster Paul S | $82,000 | |
| Closed | Kressler Adam D | $14,200 |
Source: Public Records
Tax History Compared to Growth
Tax History
| Year | Tax Paid | Tax Assessment Tax Assessment Total Assessment is a certain percentage of the fair market value that is determined by local assessors to be the total taxable value of land and additions on the property. | Land | Improvement |
|---|---|---|---|---|
| 2024 | $3,642 | $92,726 | $30,048 | $62,678 |
| 2023 | $3,664 | $92,726 | $30,048 | $62,678 |
| 2022 | $3,161 | $65,426 | $16,926 | $48,500 |
| 2021 | $3,079 | $65,426 | $16,926 | $48,500 |
| 2020 | $2,749 | $65,426 | $16,926 | $48,500 |
| 2019 | $2,587 | $57,390 | $14,847 | $42,543 |
| 2018 | $2,592 | $57,390 | $14,847 | $42,543 |
| 2017 | $2,473 | $57,390 | $14,847 | $42,543 |
| 2016 | $2,319 | $53,313 | $14,424 | $38,889 |
| 2015 | $2,335 | $53,313 | $14,424 | $38,889 |
| 2014 | $2,321 | $53,313 | $14,424 | $38,889 |
| 2013 | $2,358 | $52,266 | $14,140 | $38,126 |
Source: Public Records
Map
Nearby Homes
- 4607 Largo Dr
- 4415 Duneden Ave
- 4351 Clifford Rd
- 7261 Garden Rd
- 7123 Silver Crest Dr
- 4279 Hegner Ave
- 7610 Blue Ash Rd
- 7752 Montgomery Rd
- 7620 Montgomery Rd
- 4126 Orchard Ln
- 4250 Schenck Ave
- 4106 Orchard Ln
- 8360 Beech Ave
- 8517 Wilton Ave
- 8459 Vorhees Ln
- 8526 Myrtlewood Ave
- 8476 Saint Clair Ave
- 4158 E Galbraith Rd
- 4559 Harrison Ave
- 4248 South Ave
- 7775 Spirea Dr
- 7803 Spirea Dr
- 7761 Spirea Dr
- 7817 Spirea Dr
- 7370 Richmond Ave
- 7368 Richmond Ave
- 7374 Richmond Ave
- 7747 Spirea Dr
- 7833 Spirea Dr
- 7800 Spirea Dr
- 7782 Spirea Dr
- 7376 Richmond Ave
- 7766 Spirea Dr
- 7816 Spirea Dr
- 7356 Richmond Ave
- 7378 Richmond Ave
- 7735 Spirea Dr
- 7834 Spirea Dr
- 7748 Spirea Dr
- 7352 Richmond Ave