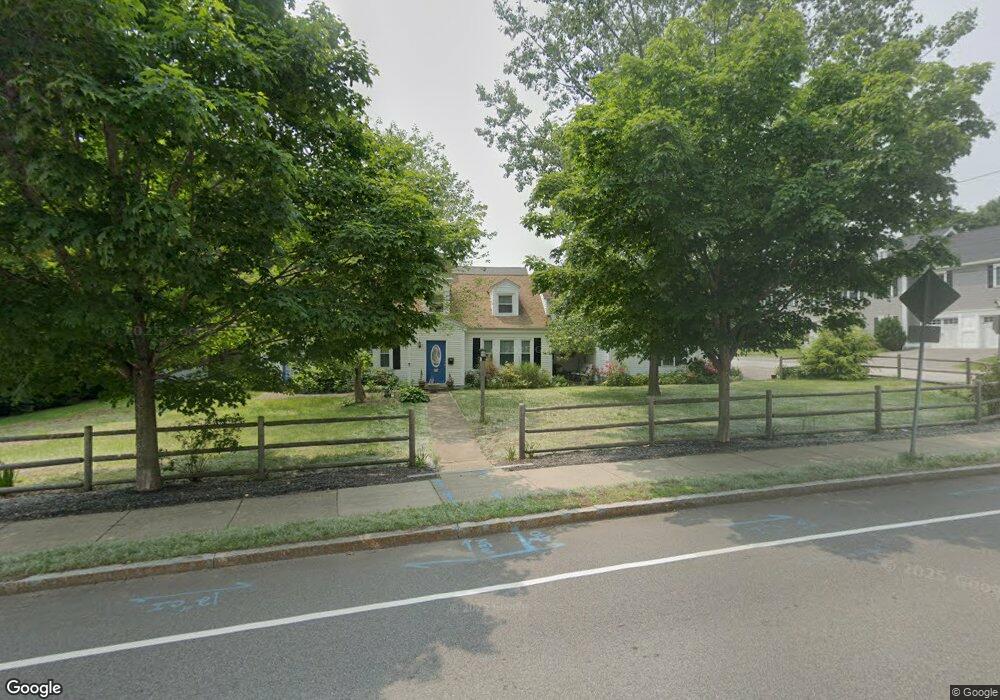
779 East St Dedham, MA 02026
Oakdale NeighborhoodEstimated Value: $937,000 - $1,048,000
4
Beds
2
Baths
2,149
Sq Ft
$469/Sq Ft
Est. Value
About This Home
This home is located at 779 East St, Dedham, MA 02026 and is currently estimated at $1,007,783, approximately $468 per square foot. 779 East St is a home located in Norfolk County with nearby schools including Oakdale Elementary School, Dedham Middle School, and Dedham High School.
Ownership History
Date
Name
Owned For
Owner Type
Purchase Details
Closed on
Jun 26, 2008
Sold by
East Street Rt and Petruzziello Giorgio
Bought by
Menard Patricia L and Menard Patrica L
Current Estimated Value
Home Financials for this Owner
Home Financials are based on the most recent Mortgage that was taken out on this home.
Original Mortgage
$130,000
Outstanding Balance
$83,867
Interest Rate
6.07%
Mortgage Type
Purchase Money Mortgage
Estimated Equity
$923,916
Purchase Details
Closed on
Feb 1, 2008
Sold by
Montague David C and Montague Joseph A
Bought by
East Street Rt and Petruzziello Giorgio
Purchase Details
Closed on
May 22, 2006
Sold by
Joseph A Montague T and Montague Joseph A
Bought by
Montague Joseph A
Create a Home Valuation Report for This Property
The Home Valuation Report is an in-depth analysis detailing your home's value as well as a comparison with similar homes in the area
Home Values in the Area
Average Home Value in this Area
Purchase History
| Date | Buyer | Sale Price | Title Company |
|---|---|---|---|
| Menard Patricia L | $425,000 | -- | |
| East Street Rt | $400,000 | -- | |
| Montague David C | -- | -- | |
| Montague Joseph A | -- | -- |
Source: Public Records
Mortgage History
| Date | Status | Borrower | Loan Amount |
|---|---|---|---|
| Open | Menard Patricia L | $130,000 |
Source: Public Records
Tax History Compared to Growth
Tax History
| Year | Tax Paid | Tax Assessment Tax Assessment Total Assessment is a certain percentage of the fair market value that is determined by local assessors to be the total taxable value of land and additions on the property. | Land | Improvement |
|---|---|---|---|---|
| 2025 | $11,575 | $917,200 | $374,100 | $543,100 |
| 2024 | $11,653 | $932,200 | $344,400 | $587,800 |
| 2023 | $11,112 | $865,400 | $319,600 | $545,800 |
| 2022 | $10,253 | $768,000 | $292,400 | $475,600 |
| 2021 | $9,558 | $699,200 | $292,400 | $406,800 |
| 2020 | $9,083 | $662,000 | $258,500 | $403,500 |
| 2019 | $8,515 | $601,800 | $226,200 | $375,600 |
| 2018 | $8,318 | $571,700 | $207,000 | $364,700 |
| 2017 | $8,035 | $544,400 | $179,700 | $364,700 |
| 2016 | $8,856 | $571,700 | $187,500 | $384,200 |
| 2015 | $8,141 | $513,000 | $169,900 | $343,100 |
| 2014 | $7,963 | $495,200 | $159,500 | $335,700 |
Source: Public Records
Map
Nearby Homes
- 183 Grant Ave
- 18 Boulevard Rd
- 414 Cedar St
- 94 Madison St
- 50 Sprague St
- 989 East St Unit 107
- 989 East St Unit 403
- 79 Sprague St
- 155 Mount Vernon St
- 17 Savin St
- 12 Tarbox St
- 94 Border St
- 22 Azalea Cir
- 27 Edison Ave
- 163 Whiting Ave
- 10 Fairview St
- 56 Mount Vernon St
- 50 Clark St
- 111 Greensboro Rd
- 30 Granite St