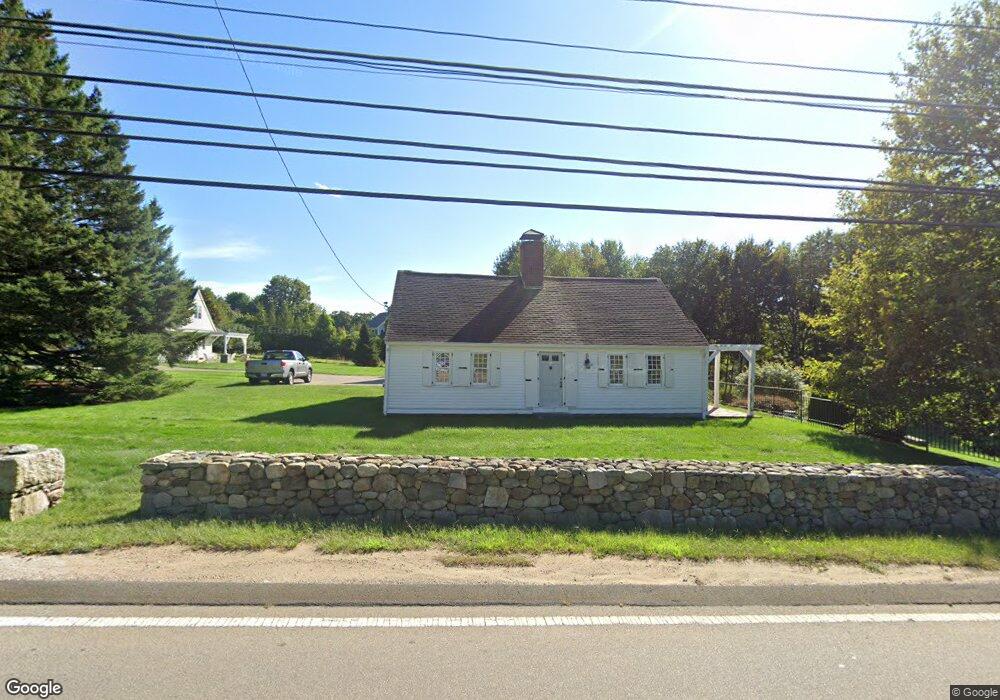
779 West St Wrentham, MA 02093
Sheldonville NeighborhoodEstimated Value: $581,000 - $782,000
3
Beds
2
Baths
2,680
Sq Ft
$266/Sq Ft
Est. Value
About This Home
This home is located at 779 West St, Wrentham, MA 02093 and is currently estimated at $712,414, approximately $265 per square foot. 779 West St is a home located in Norfolk County with nearby schools including Delaney Elementary School, Charles E Roderick, and Mercymount Country Day School.
Ownership History
Date
Name
Owned For
Owner Type
Purchase Details
Closed on
Oct 17, 1997
Sold by
Fountas George N
Bought by
Reynolds John C and Reynolds Susan N
Current Estimated Value
Create a Home Valuation Report for This Property
The Home Valuation Report is an in-depth analysis detailing your home's value as well as a comparison with similar homes in the area
Home Values in the Area
Average Home Value in this Area
Purchase History
| Date | Buyer | Sale Price | Title Company |
|---|---|---|---|
| Reynolds John C | $218,400 | -- |
Source: Public Records
Mortgage History
| Date | Status | Borrower | Loan Amount |
|---|---|---|---|
| Open | Reynolds John C | $304,000 | |
| Closed | Reynolds John C | $167,000 | |
| Closed | Reynolds John C | $193,050 |
Source: Public Records
Tax History
| Year | Tax Paid | Tax Assessment Tax Assessment Total Assessment is a certain percentage of the fair market value that is determined by local assessors to be the total taxable value of land and additions on the property. | Land | Improvement |
|---|---|---|---|---|
| 2025 | $7,404 | $638,800 | $288,000 | $350,800 |
| 2024 | $7,439 | $619,900 | $288,000 | $331,900 |
| 2023 | $6,519 | $516,600 | $261,900 | $254,700 |
| 2022 | $7,192 | $526,100 | $255,100 | $271,000 |
| 2021 | $7,053 | $501,300 | $238,400 | $262,900 |
| 2020 | $6,783 | $476,000 | $182,000 | $294,000 |
| 2019 | $6,464 | $457,800 | $163,800 | $294,000 |
| 2018 | $7,534 | $529,100 | $163,600 | $365,500 |
| 2017 | $7,342 | $515,200 | $160,500 | $354,700 |
| 2016 | $7,191 | $503,600 | $155,800 | $347,800 |
| 2015 | $7,426 | $495,700 | $166,500 | $329,200 |
| 2014 | $7,327 | $478,600 | $160,100 | $318,500 |
Source: Public Records
Map
Nearby Homes
- 613 West St
- 440 Chestnut St
- 955 Summer St
- 20 Field Cir
- 11 Amber Dr
- 19 Chestnut Lot 0
- 1222 South St
- 18 Huntington Ave
- 0 Fall Ln
- 1565 West St
- 1620 West St
- 0 Berry St
- 9 Reagan Ave
- 10 Earle Stewart Ln Unit Lot 5
- 12 Earle Stewart Ln
- 2 Earle Stewart Ln
- 3 Earle Stewart Ln
- 10 Follett Dr
- 60 Grant Ave
- 139 King St Unit 306
Your Personal Tour Guide
Ask me questions while you tour the home.