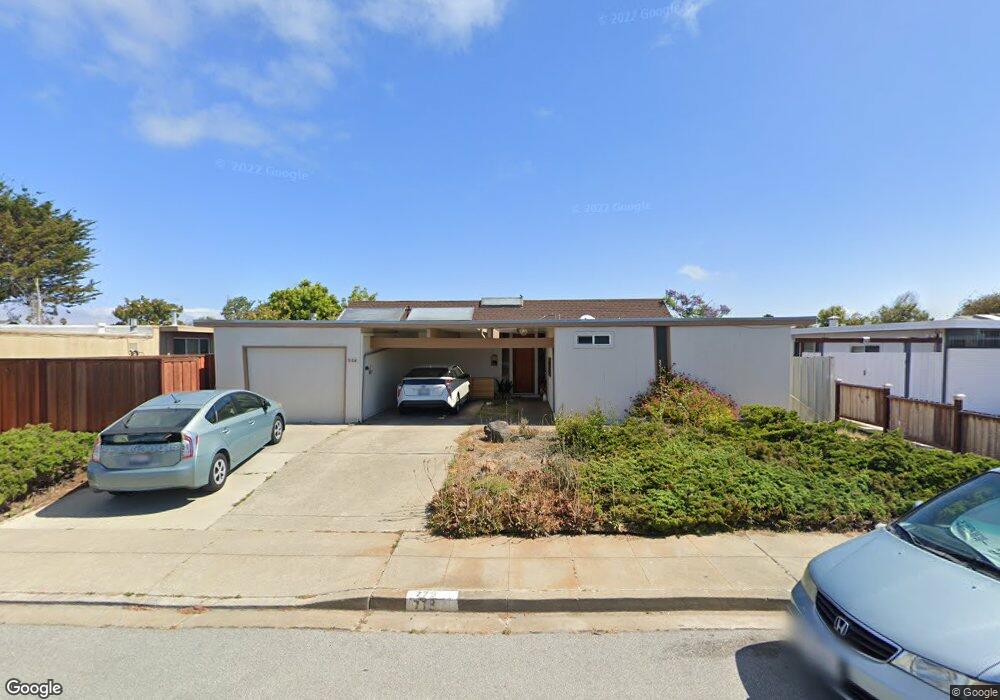
779 Widgeon St Foster City, CA 94404
Bay Vista NeighborhoodEstimated Value: $1,788,612 - $1,976,000
3
Beds
2
Baths
1,570
Sq Ft
$1,205/Sq Ft
Est. Value
About This Home
This home is located at 779 Widgeon St, Foster City, CA 94404 and is currently estimated at $1,891,403, approximately $1,204 per square foot. 779 Widgeon St is a home located in San Mateo County with nearby schools including Audubon Elementary School, Bowditch Middle School, and San Mateo High School.
Ownership History
Date
Name
Owned For
Owner Type
Purchase Details
Closed on
Feb 2, 2020
Sold by
Hwang Jung Shyn and Hwang Li
Bought by
Hwang Jung Shyn and Hwang Li
Current Estimated Value
Purchase Details
Closed on
Jun 4, 2007
Sold by
Hwang Jung Shyh
Bought by
Hwang Jung Shyh and Hwang Li
Home Financials for this Owner
Home Financials are based on the most recent Mortgage that was taken out on this home.
Original Mortgage
$250,000
Outstanding Balance
$152,559
Interest Rate
6.14%
Mortgage Type
Credit Line Revolving
Estimated Equity
$1,738,844
Purchase Details
Closed on
May 6, 2004
Sold by
Hwang Chien and Hwang Chan Shiu Han
Bought by
Hwang Chien and Hwang Chan Shiu Han
Purchase Details
Closed on
Oct 29, 2002
Sold by
Hwang Chien and Hwang Chan Shiu Han
Bought by
Hwang Jung Shyh and Hwang Li
Home Financials for this Owner
Home Financials are based on the most recent Mortgage that was taken out on this home.
Original Mortgage
$150,000
Interest Rate
5.39%
Purchase Details
Closed on
Jan 14, 1999
Sold by
Hwang Li
Bought by
Hwang Jung Shyh
Create a Home Valuation Report for This Property
The Home Valuation Report is an in-depth analysis detailing your home's value as well as a comparison with similar homes in the area
Home Values in the Area
Average Home Value in this Area
Purchase History
| Date | Buyer | Sale Price | Title Company |
|---|---|---|---|
| Hwang Jung Shyn | -- | None Available | |
| Hwang Jung Shyh | -- | Ticor Title Company Of Ca | |
| Hwang Jung Shyh | -- | Ticor Title Company Of Ca | |
| Hwang Chien | -- | -- | |
| Hwang Jung Shyh | -- | American Title | |
| Hwang Jung Shyh | -- | Fidelity National Title Co |
Source: Public Records
Mortgage History
| Date | Status | Borrower | Loan Amount |
|---|---|---|---|
| Open | Hwang Jung Shyh | $250,000 | |
| Previous Owner | Hwang Jung Shyh | $150,000 |
Source: Public Records
Tax History Compared to Growth
Tax History
| Year | Tax Paid | Tax Assessment Tax Assessment Total Assessment is a certain percentage of the fair market value that is determined by local assessors to be the total taxable value of land and additions on the property. | Land | Improvement |
|---|---|---|---|---|
| 2025 | $6,792 | $563,416 | $281,708 | $281,708 |
| 2023 | $6,792 | $541,540 | $270,770 | $270,770 |
| 2022 | $6,552 | $530,922 | $265,461 | $265,461 |
| 2021 | $6,459 | $520,512 | $260,256 | $260,256 |
| 2020 | $6,284 | $515,176 | $257,588 | $257,588 |
| 2019 | $5,960 | $505,076 | $252,538 | $252,538 |
| 2018 | $5,559 | $495,174 | $247,587 | $247,587 |
| 2017 | $5,494 | $485,466 | $242,733 | $242,733 |
| 2016 | $5,581 | $475,948 | $237,974 | $237,974 |
| 2015 | $5,449 | $468,800 | $234,400 | $234,400 |
| 2014 | $5,310 | $459,618 | $229,809 | $229,809 |
Source: Public Records
Map
Nearby Homes
- 748 Gull Ave
- 275 Puffin Ct
- 650 Pilgrim Dr
- 591 Pilgrim Dr
- 224 Loon Ct
- 3206 Admiralty Ln
- 1102 Admiralty Ln
- 1074 Eagle Ln
- 1351 Marlin Ave
- 1336 Marlin Ave
- 708 Thayer Ln Unit 404
- 769 Eppleton Ln Unit 302
- 1028 Foster Square Ln Unit 305
- 708 Eppleton Ln Unit 204
- 718 Eppleton Ln Unit 303
- 241 Bonita Ln
- 926 Lido Ln
- 1018 Lido Ln
- 825 Cortez Ln
- 822 Magellan Ln