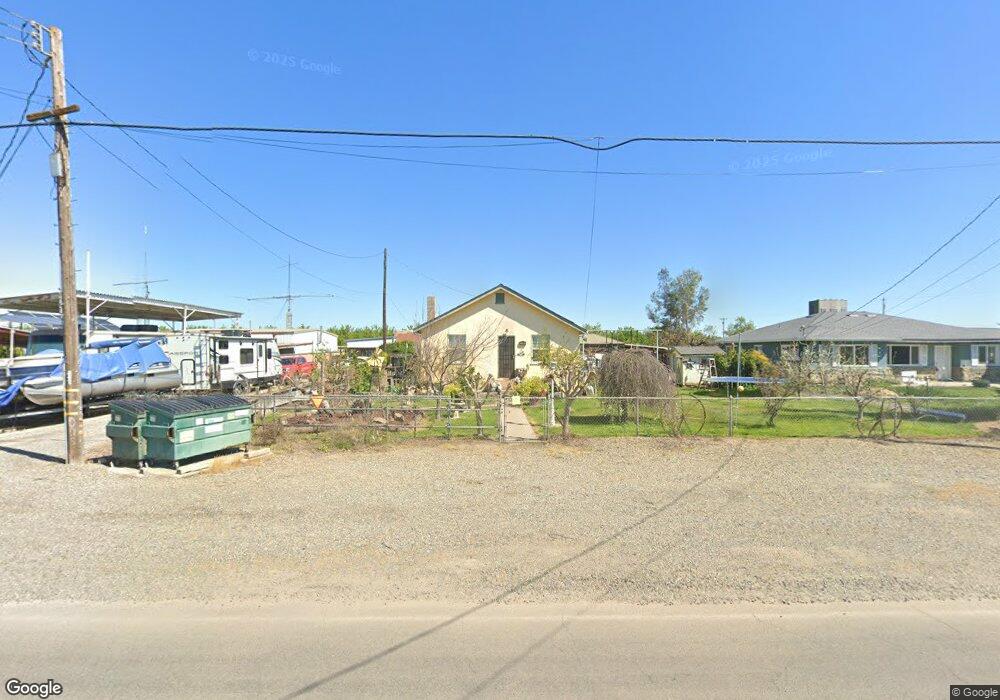
7790 N Winton Way Winton, CA 95388
Estimated Value: $216,612 - $307,000
4
Beds
1
Bath
832
Sq Ft
$302/Sq Ft
Est. Value
About This Home
This home is located at 7790 N Winton Way, Winton, CA 95388 and is currently estimated at $250,903, approximately $301 per square foot. 7790 N Winton Way is a home located in Merced County with nearby schools including Winfield Elementary School, Winton Middle School, and Atwater High School.
Ownership History
Date
Name
Owned For
Owner Type
Purchase Details
Closed on
Sep 16, 2005
Sold by
Loewen Betty L and Loewen Raymond S
Bought by
Loewen Melvin R and Loewen Cheryl A
Current Estimated Value
Home Financials for this Owner
Home Financials are based on the most recent Mortgage that was taken out on this home.
Original Mortgage
$155,000
Interest Rate
5.72%
Mortgage Type
Stand Alone Refi Refinance Of Original Loan
Purchase Details
Closed on
Jun 22, 2004
Sold by
Loewen Betty L and Loewen Raymond S
Bought by
Loewen Raymond S and Loewen Betty L
Purchase Details
Closed on
Sep 25, 2002
Sold by
Loewen Raymond S and Loewen Betty L
Bought by
Loewen Raymond S and Loewen Betty L
Home Financials for this Owner
Home Financials are based on the most recent Mortgage that was taken out on this home.
Original Mortgage
$87,000
Interest Rate
6.22%
Mortgage Type
Purchase Money Mortgage
Create a Home Valuation Report for This Property
The Home Valuation Report is an in-depth analysis detailing your home's value as well as a comparison with similar homes in the area
Home Values in the Area
Average Home Value in this Area
Purchase History
| Date | Buyer | Sale Price | Title Company |
|---|---|---|---|
| Loewen Melvin R | -- | United Capital Title Ins Co | |
| Loewen Raymond S | -- | -- | |
| Loewen Raymond S | -- | Title Court Services Inc |
Source: Public Records
Mortgage History
| Date | Status | Borrower | Loan Amount |
|---|---|---|---|
| Closed | Loewen Melvin R | $155,000 | |
| Closed | Loewen Raymond S | $87,000 |
Source: Public Records
Tax History Compared to Growth
Tax History
| Year | Tax Paid | Tax Assessment Tax Assessment Total Assessment is a certain percentage of the fair market value that is determined by local assessors to be the total taxable value of land and additions on the property. | Land | Improvement |
|---|---|---|---|---|
| 2025 | $569 | $62,126 | $31,063 | $31,063 |
| 2024 | $569 | $60,908 | $30,454 | $30,454 |
| 2023 | $557 | $59,714 | $29,857 | $29,857 |
| 2022 | $547 | $58,544 | $29,272 | $29,272 |
| 2021 | $541 | $57,398 | $28,699 | $28,699 |
| 2020 | $533 | $56,810 | $28,405 | $28,405 |
| 2019 | $520 | $55,698 | $27,849 | $27,849 |
| 2018 | $505 | $54,606 | $27,303 | $27,303 |
| 2017 | $497 | $53,536 | $26,768 | $26,768 |
| 2016 | $489 | $52,488 | $26,244 | $26,244 |
| 2015 | $481 | $51,700 | $25,850 | $25,850 |
| 2014 | $469 | $50,688 | $25,344 | $25,344 |
Source: Public Records
Map
Nearby Homes
- 6848 Beth Cir
- 7294 Edythe Cir
- 7181 Pine St
- 6839 Mercedes Ave
- 0 Eucalyptus Ave
- 7140 Jones Rd
- 6143 Olive Ave
- 7219 Tokay Cir
- 7638 Walnut Ave
- 6800 Helton St
- 7535 Fairlane Ave
- 7685 Walnut Ave
- 6555 Eden Ave
- 6631 Aggies Ct
- 6617 California St
- 9895 Palm Ave
- 0 Palm Ave
- 7040 Doris Ave
- 7161 Bobbie Ave
- 6289 Monica Way
- 7820 N Winton Way
- 7774 N Winton Way
- 7830 N Winton Way
- 7756 N Winton Way
- 7844 N Winton Way
- 7866 N Winton Way
- 7713 N Winton Way
- 7655 N Winton Way
- 0 Winton Way Unit MC12013576
- 0 Winton Way Unit CRMC25055841
- 0 Winton Way Unit MC25055841
- 0 Winton Way Unit CRMC24192382
- 0 Winton Way Unit CRMC24232816
- 0 Winton Way Unit CRMC24125862
- 0 Winton Way Unit MC24192382
- 0 Winton Way Unit MC24061163
- 0 Winton Way Unit MC23072637
- 0 Winton Way Unit 19076206
- 0 Winton Way Unit MC19259703
- 0 Winton Way Unit MC19259670