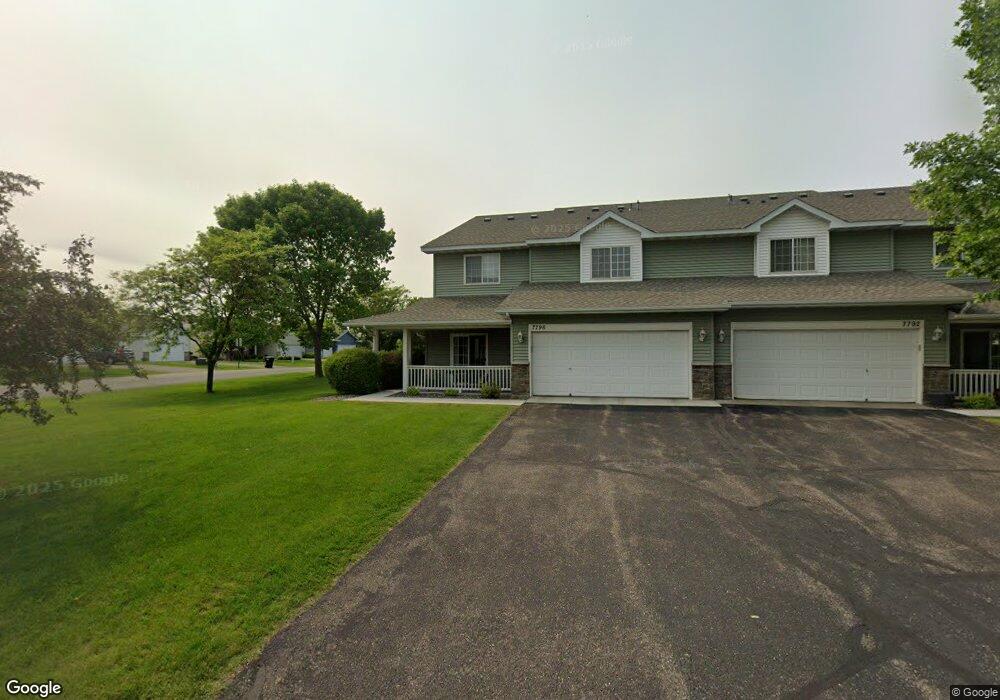
7796 Palomino Ave NE Elk River, MN 55330
Estimated Value: $292,706 - $317,000
3
Beds
3
Baths
1,504
Sq Ft
$201/Sq Ft
Est. Value
About This Home
This home is located at 7796 Palomino Ave NE, Elk River, MN 55330 and is currently estimated at $302,677, approximately $201 per square foot. 7796 Palomino Ave NE is a home located in Wright County with nearby schools including Otsego Elementary School, Rogers Middle School, and Rogers Senior High School.
Ownership History
Date
Name
Owned For
Owner Type
Purchase Details
Closed on
Jun 26, 2018
Sold by
Petersen Cole C
Bought by
Perkins Aaron
Current Estimated Value
Home Financials for this Owner
Home Financials are based on the most recent Mortgage that was taken out on this home.
Original Mortgage
$186,240
Outstanding Balance
$161,762
Interest Rate
4.6%
Mortgage Type
New Conventional
Estimated Equity
$140,915
Purchase Details
Closed on
Aug 16, 2016
Sold by
Gllddon Zachary and Gllddon Ellsabeth
Bought by
Petersen Cole C
Purchase Details
Closed on
Aug 15, 2016
Sold by
Gliddon Zachary and Gliddon Elisabeth
Bought by
Petersen Cole C
Purchase Details
Closed on
Jul 22, 2011
Sold by
Fnma
Bought by
Gliddon Elisabeth and Gliddon Zachary
Purchase Details
Closed on
Jan 31, 2003
Sold by
Eagle Crest Northwest Townhomes Inc
Bought by
Hennum April L
Purchase Details
Closed on
Jan 18, 2002
Sold by
Arcon Development Inc
Bought by
Castlebar Homes Llc
Create a Home Valuation Report for This Property
The Home Valuation Report is an in-depth analysis detailing your home's value as well as a comparison with similar homes in the area
Home Values in the Area
Average Home Value in this Area
Purchase History
| Date | Buyer | Sale Price | Title Company |
|---|---|---|---|
| Perkins Aaron | $192,000 | Liberty Title Inc | |
| Petersen Cole C | $169,900 | Alliance Title | |
| Petersen Cole C | -- | Alliance Title | |
| Gliddon Elisabeth | $104,900 | -- | |
| Hennum April L | $163,500 | -- | |
| Castlebar Homes Llc | $204,000 | -- |
Source: Public Records
Mortgage History
| Date | Status | Borrower | Loan Amount |
|---|---|---|---|
| Open | Perkins Aaron | $186,240 |
Source: Public Records
Tax History Compared to Growth
Tax History
| Year | Tax Paid | Tax Assessment Tax Assessment Total Assessment is a certain percentage of the fair market value that is determined by local assessors to be the total taxable value of land and additions on the property. | Land | Improvement |
|---|---|---|---|---|
| 2025 | $2,464 | $263,300 | $45,000 | $218,300 |
| 2024 | $2,652 | $242,000 | $30,000 | $212,000 |
| 2023 | $2,742 | $259,500 | $38,500 | $221,000 |
| 2022 | $2,442 | $238,100 | $35,000 | $203,100 |
| 2021 | $2,446 | $192,900 | $20,000 | $172,900 |
| 2020 | $2,440 | $189,700 | $20,000 | $169,700 |
| 2019 | $2,114 | $185,900 | $0 | $0 |
| 2018 | $1,968 | $156,300 | $0 | $0 |
| 2017 | $1,982 | $145,800 | $0 | $0 |
| 2016 | $1,912 | $0 | $0 | $0 |
| 2015 | $1,730 | $0 | $0 | $0 |
| 2014 | -- | $0 | $0 | $0 |
Source: Public Records
Map
Nearby Homes
- 7742 Palomino Ave NE
- 7616 Palomino Ave NE
- 15341 76th St NE
- 15302 74th St NE
- 7944 Palmgren Ave NE
- 7243 Paris Ave NE
- 7276 Parell Ave NE
- 7257 Paris Ave NE
- 15731 79th St NE
- 7229 Paris Ave NE
- 14675 77th St NE
- 15365 71st St NE
- 12403 81st St NE
- 7201 Paris Ave NE
- 7187 Paris Ave NE
- 14638 74th St NE
- 14638 74th Ln NE
- 15509 71st St NE
- 15580 71st St NE
- McKinley Plan at Meadows of Otsego
- 7796 7796 Palomino Ave NE
- 7797 Palisades Ave NE
- 7792 Palomino Ave NE
- 7793 Palisades Ave NE
- 7793 7793 Palisades Ave NE
- 7784 Palomino Ave NE
- 7784 7784 Palomino Ave NE
- 7791 Palomino Ave NE
- 7791 7791 Palomino Ave
- 7789 Palomino Ave NE
- 7780 Palomino Ave NE
- 7780 7780 Palomino Ave NE
- 15237 76th St NE
- 15225 76th St NE
- 15278 76th St NE
- 15278 15278 76th St NE
- 15278 76th
- 15278 76th
- 15278 76th St NE
- 15276 76th St