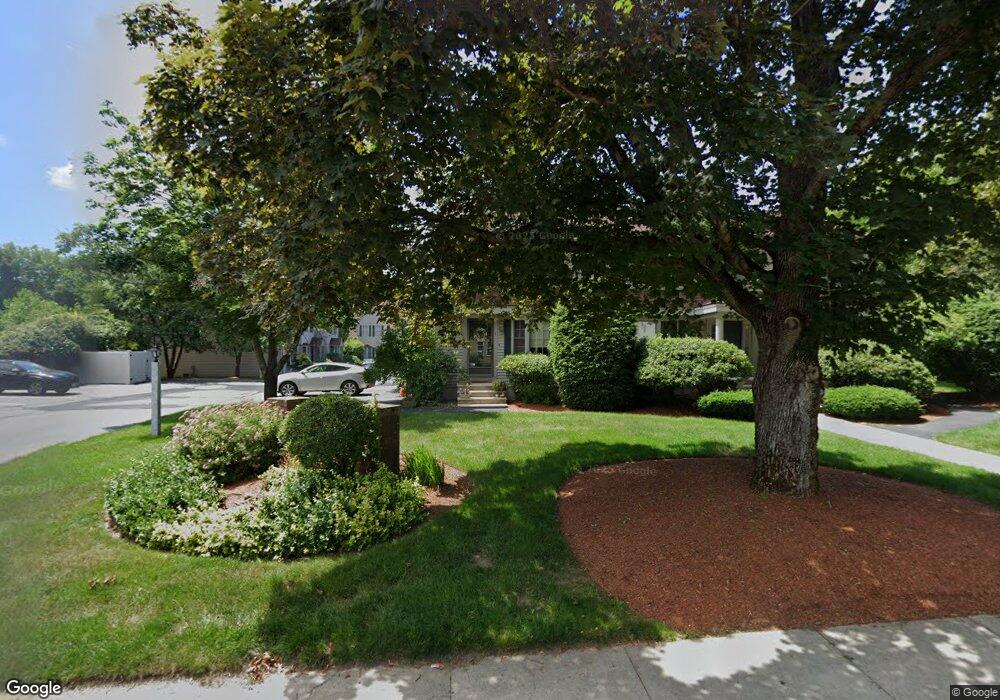
78 Allds St Unit U4 Nashua, NH 03060
Downtown Nashua NeighborhoodEstimated Value: $320,000 - $373,000
2
Beds
1
Bath
1,135
Sq Ft
$298/Sq Ft
Est. Value
About This Home
This home is located at 78 Allds St Unit U4, Nashua, NH 03060 and is currently estimated at $338,202, approximately $297 per square foot. 78 Allds St Unit U4 is a home located in Hillsborough County with nearby schools including Dr. Norman W. Crisp Elementary School, Elm Street Middle School, and Nashua High School North.
Ownership History
Date
Name
Owned For
Owner Type
Purchase Details
Closed on
Jul 7, 2025
Sold by
Ajaka Abiola A and Ajaka Kaitlyn E
Bought by
Tucci William R
Current Estimated Value
Home Financials for this Owner
Home Financials are based on the most recent Mortgage that was taken out on this home.
Original Mortgage
$251,325
Outstanding Balance
$250,254
Interest Rate
6.86%
Mortgage Type
New Conventional
Estimated Equity
$87,948
Purchase Details
Closed on
Sep 29, 2020
Sold by
Sargent Ft and Sargent
Bought by
Ajaka Abiola A and Ajaka Kaitlyn E
Home Financials for this Owner
Home Financials are based on the most recent Mortgage that was taken out on this home.
Original Mortgage
$205,155
Interest Rate
2.9%
Mortgage Type
New Conventional
Purchase Details
Closed on
Jul 18, 2019
Sold by
Sargent Stephanie A and Sargent Michael W
Bought by
Sargent Ft
Purchase Details
Closed on
Jul 7, 2015
Sold by
Morgan Jonathan
Bought by
Sargent Stephen A and Sargent Michael W
Home Financials for this Owner
Home Financials are based on the most recent Mortgage that was taken out on this home.
Original Mortgage
$170,720
Interest Rate
3.83%
Mortgage Type
New Conventional
Purchase Details
Closed on
Jul 9, 2007
Sold by
Medina Daniel R and Medina Krystina B
Bought by
Morgan Jonathan
Create a Home Valuation Report for This Property
The Home Valuation Report is an in-depth analysis detailing your home's value as well as a comparison with similar homes in the area
Home Values in the Area
Average Home Value in this Area
Purchase History
| Date | Buyer | Sale Price | Title Company |
|---|---|---|---|
| Tucci William R | $335,533 | -- | |
| Tucci William R | $335,533 | -- | |
| Ajaka Abiola A | $212,000 | None Available | |
| Ajaka Abiola A | $212,000 | None Available | |
| Sargent Ft | -- | -- | |
| Sargent Stephen A | $176,000 | -- | |
| Sargent Stephen A | $176,000 | -- | |
| Morgan Jonathan | $190,000 | -- | |
| Morgan Jonathan | $190,000 | -- |
Source: Public Records
Mortgage History
| Date | Status | Borrower | Loan Amount |
|---|---|---|---|
| Open | Tucci William R | $251,325 | |
| Closed | Tucci William R | $251,325 | |
| Previous Owner | Ajaka Abiola A | $205,155 | |
| Previous Owner | Morgan Jonathan | $170,720 | |
| Previous Owner | Morgan Jonathan | $136,000 |
Source: Public Records
Tax History Compared to Growth
Tax History
| Year | Tax Paid | Tax Assessment Tax Assessment Total Assessment is a certain percentage of the fair market value that is determined by local assessors to be the total taxable value of land and additions on the property. | Land | Improvement |
|---|---|---|---|---|
| 2024 | $4,228 | $265,900 | $0 | $265,900 |
| 2023 | $4,014 | $220,200 | $0 | $220,200 |
| 2022 | $3,979 | $220,200 | $0 | $220,200 |
| 2021 | $3,546 | $152,700 | $0 | $152,700 |
| 2020 | $3,453 | $152,700 | $0 | $152,700 |
| 2019 | $3,323 | $152,700 | $0 | $152,700 |
| 2018 | $3,239 | $152,700 | $0 | $152,700 |
| 2017 | $3,510 | $136,100 | $0 | $136,100 |
| 2016 | $3,412 | $136,100 | $0 | $136,100 |
| 2015 | $3,240 | $132,100 | $0 | $132,100 |
| 2014 | -- | $132,100 | $0 | $132,100 |
Source: Public Records
Map
Nearby Homes
- 65 Allds St
- 2 Lyons St
- 13 Mulvanity St
- 18 Harbor Ave Unit 208
- 24 E Otterson St
- 1 Circle Ave
- 5 Mulberry St
- 4 Chase St
- 76 Gillis St
- 15 Lovell St Unit 3
- 15 Lovell St Unit 7
- 15 Lovell St Unit 10
- 27 Fifield St Unit 13
- 8 Buck St Unit 10
- 22 Wilder St
- 38 Central St
- 13 Sapphire Ln
- 30 Ledge St
- 46 Perham St Unit 214
- 15 Atherton Ave
- 78 Allds St Unit Z
- 78 Allds St Unit U9
- 78 Allds St Unit U8
- 78 Allds St Unit U7
- 78 Allds St Unit U6
- 78 Allds St Unit U5
- 78 Allds St Unit U3
- 78 Allds St Unit U2
- 78 Allds St Unit U13
- 78 Allds St Unit U12
- 78 Allds St Unit U11
- 78 Allds St Unit U10
- 78 Allds St Unit U1
- 78 Allds St Unit 3
- 78 Allds St Unit 2
- 78 Allds St Unit 6
- 78 Allds St Unit 9
- 78 Allds St Unit 8
- 78 Allds St
- 6 Nye Ave