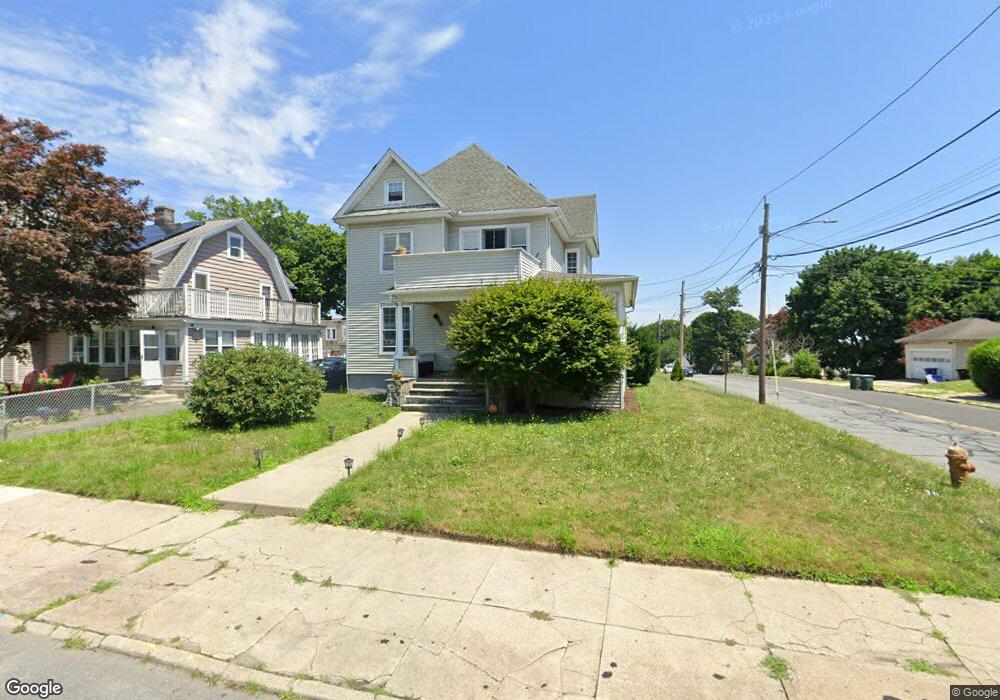
78 Beechmont Ave Unit 1ST Bridgeport, CT 06606
North End NeighborhoodEstimated Value: $501,325 - $747,000
2
Beds
1
Bath
1,343
Sq Ft
$490/Sq Ft
Est. Value
About This Home
This home is located at 78 Beechmont Ave Unit 1ST, Bridgeport, CT 06606 and is currently estimated at $658,331, approximately $490 per square foot. 78 Beechmont Ave Unit 1ST is a home located in Fairfield County with nearby schools including Blackham School, Central High School, and Northeastern Adventist Academy - Fairfield County.
Ownership History
Date
Name
Owned For
Owner Type
Purchase Details
Closed on
Jul 22, 2020
Sold by
Fernandez Angel L and Perez Iris N
Bought by
Scott Torrell
Current Estimated Value
Home Financials for this Owner
Home Financials are based on the most recent Mortgage that was taken out on this home.
Original Mortgage
$402,573
Outstanding Balance
$356,975
Interest Rate
3.1%
Mortgage Type
FHA
Estimated Equity
$301,356
Purchase Details
Closed on
Sep 25, 2007
Sold by
Wicks Norma
Bought by
Fernandez Angel and Perez Iris
Home Financials for this Owner
Home Financials are based on the most recent Mortgage that was taken out on this home.
Original Mortgage
$327,750
Interest Rate
6.63%
Create a Home Valuation Report for This Property
The Home Valuation Report is an in-depth analysis detailing your home's value as well as a comparison with similar homes in the area
Home Values in the Area
Average Home Value in this Area
Purchase History
| Date | Buyer | Sale Price | Title Company |
|---|---|---|---|
| Scott Torrell | $410,000 | None Available | |
| Scott Torrell | $410,000 | None Available | |
| Fernandez Angel | $345,000 | -- | |
| Fernandez Angel | $345,000 | -- |
Source: Public Records
Mortgage History
| Date | Status | Borrower | Loan Amount |
|---|---|---|---|
| Open | Scott Torrell | $402,573 | |
| Closed | Scott Torrell | $402,573 | |
| Previous Owner | Fernandez Angel | $326,100 | |
| Previous Owner | Fernandez Angel | $332,525 | |
| Previous Owner | Fernandez Angel | $327,750 |
Source: Public Records
Tax History
| Year | Tax Paid | Tax Assessment Tax Assessment Total Assessment is a certain percentage of the fair market value that is determined by local assessors to be the total taxable value of land and additions on the property. | Land | Improvement |
|---|---|---|---|---|
| 2025 | $9,976 | $229,606 | $61,036 | $168,570 |
| 2024 | $9,976 | $229,606 | $61,036 | $168,570 |
| 2023 | $9,976 | $229,606 | $61,036 | $168,570 |
| 2022 | $9,976 | $229,606 | $61,036 | $168,570 |
| 2021 | $10,285 | $236,706 | $61,036 | $175,670 |
| 2020 | $7,773 | $143,980 | $37,020 | $106,960 |
| 2019 | $7,773 | $143,980 | $37,020 | $106,960 |
| 2018 | $7,828 | $143,980 | $37,020 | $106,960 |
| 2017 | $7,828 | $143,980 | $37,020 | $106,960 |
| 2016 | $7,828 | $143,980 | $37,020 | $106,960 |
| 2015 | $7,460 | $176,770 | $37,310 | $139,460 |
| 2014 | $7,460 | $176,770 | $37,310 | $139,460 |
Source: Public Records
Map
Nearby Homes
- 457 Summit St
- 25 Westfield Ave
- 1265 Lindley St
- 95 Savoy St
- 208 Fairview Ave Unit 210
- 45 Stevens St Unit 3L
- 329 Ezra St
- 234 Savoy St
- 3461 Main St
- 926 Hart St
- 916 Hart St
- 74 Harlem Ave
- 120 Clark St
- 26 Marsdale Ave
- 123 Harlem Ave
- 936 Lindley St
- 254 Wayne St
- 420 Greenwood St
- 138 Infield St
- 631 Fairview Ave
- 78 Beechmont Ave
- 94 Beechmont Ave
- 160 Springdale St
- 160 Springdale St Unit 162
- 96 Beechmont Ave Unit 98
- 40 Beechmont Ave
- 104 Beechmont Ave Unit 106
- 104 Beechmont Ave Unit 2
- 104 Beechmont Ave Unit 1
- 3250 Main St Unit 213
- 3250 Main St Unit 212
- 3250 Main St Unit 211
- 3250 Main St Unit 210
- 3250 Main St Unit 209
- 3250 Main St Unit 113
- 3250 Main St Unit 112
- 3250 Main St Unit 111
- 3250 Main St Unit 110
- 3250 Main St Unit 109
- 3250 Main St
Your Personal Tour Guide
Ask me questions while you tour the home.