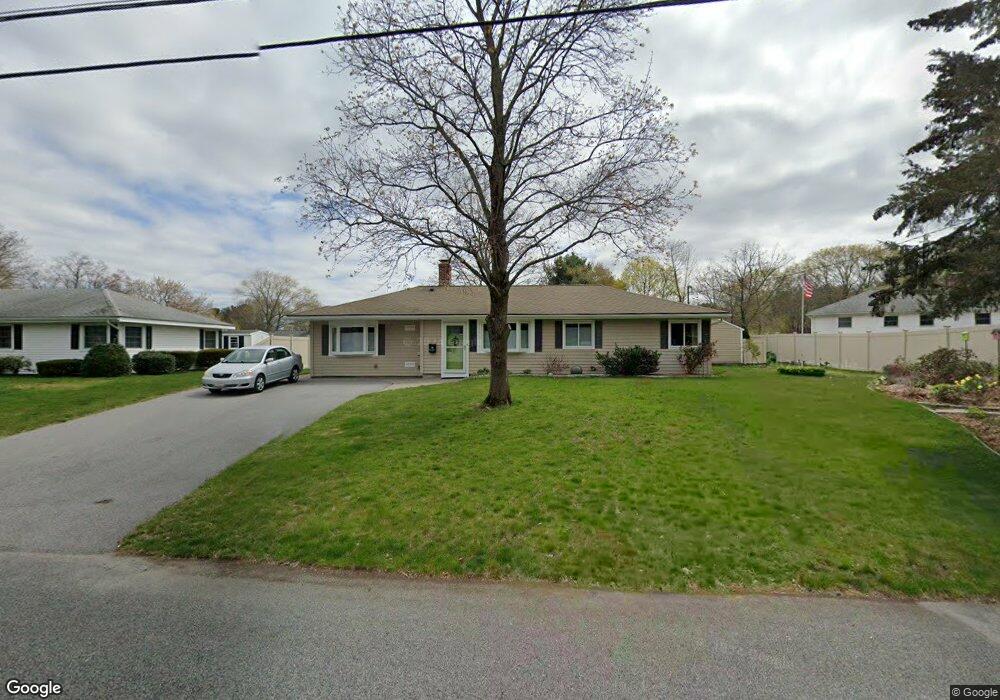
78 Brookfield Cir Framingham, MA 01701
Nobscot NeighborhoodEstimated Value: $567,235 - $587,000
3
Beds
1
Bath
1,242
Sq Ft
$464/Sq Ft
Est. Value
About This Home
This home is located at 78 Brookfield Cir, Framingham, MA 01701 and is currently estimated at $576,559, approximately $464 per square foot. 78 Brookfield Cir is a home located in Middlesex County with nearby schools including Framingham High School, MetroWest Jewish Day School, and Saint Bridget School.
Ownership History
Date
Name
Owned For
Owner Type
Purchase Details
Closed on
Oct 25, 2017
Sold by
Pink J Gregory J and Pink Diane M
Bought by
J Gregory & D M Pink Lt and Pink
Current Estimated Value
Purchase Details
Closed on
May 7, 2008
Sold by
Model Daniel J
Bought by
Pink Dana L and Pink Jason G
Home Financials for this Owner
Home Financials are based on the most recent Mortgage that was taken out on this home.
Original Mortgage
$223,250
Interest Rate
5.93%
Mortgage Type
Purchase Money Mortgage
Purchase Details
Closed on
May 23, 2001
Sold by
Dillon Diane M
Bought by
Model Daniel J
Home Financials for this Owner
Home Financials are based on the most recent Mortgage that was taken out on this home.
Original Mortgage
$150,000
Interest Rate
7.05%
Mortgage Type
Purchase Money Mortgage
Purchase Details
Closed on
Jun 1, 2000
Sold by
Baker Michael E and Baker Pamela A
Bought by
Chaisson Joseph G and Dillon Diane M
Purchase Details
Closed on
Mar 22, 1995
Sold by
Est Young Alice L and Tashjian James E
Bought by
Baker Michael E and Baker Pamela A
Create a Home Valuation Report for This Property
The Home Valuation Report is an in-depth analysis detailing your home's value as well as a comparison with similar homes in the area
Home Values in the Area
Average Home Value in this Area
Purchase History
| Date | Buyer | Sale Price | Title Company |
|---|---|---|---|
| J Gregory & D M Pink Lt | -- | -- | |
| J Gregory & D M Pink Lt | -- | -- | |
| Pink Dana L | $235,000 | -- | |
| Pink Dana L | $235,000 | -- | |
| Model Daniel J | $237,000 | -- | |
| Model Daniel J | $237,000 | -- | |
| Chaisson Joseph G | $197,500 | -- | |
| Baker Michael E | $130,500 | -- | |
| Baker Michael E | $130,500 | -- |
Source: Public Records
Mortgage History
| Date | Status | Borrower | Loan Amount |
|---|---|---|---|
| Previous Owner | Baker Michael E | $150,000 | |
| Previous Owner | Pink Dana L | $223,250 | |
| Previous Owner | Model Daniel J | $150,000 |
Source: Public Records
Tax History Compared to Growth
Tax History
| Year | Tax Paid | Tax Assessment Tax Assessment Total Assessment is a certain percentage of the fair market value that is determined by local assessors to be the total taxable value of land and additions on the property. | Land | Improvement |
|---|---|---|---|---|
| 2025 | $5,952 | $498,500 | $260,700 | $237,800 |
| 2024 | $5,592 | $448,800 | $232,800 | $216,000 |
| 2023 | $5,317 | $406,200 | $207,800 | $198,400 |
| 2022 | $5,005 | $364,300 | $188,600 | $175,700 |
| 2021 | $4,840 | $344,500 | $181,200 | $163,300 |
| 2020 | $4,786 | $319,500 | $164,700 | $154,800 |
| 2019 | $4,725 | $307,200 | $164,700 | $142,500 |
| 2018 | $4,632 | $283,800 | $158,500 | $125,300 |
| 2017 | $4,507 | $269,700 | $153,900 | $115,800 |
| 2016 | $4,581 | $263,600 | $153,900 | $109,700 |
| 2015 | $4,623 | $259,400 | $154,200 | $105,200 |
Source: Public Records
Map
Nearby Homes
- 217 Central St
- 82 Joseph Rd
- 15 Fairbrook Rd
- 163 Water St
- 1 Brookvale Rd
- 19 Park Ave
- 14 Francine Rd
- 81 Nicholas Rd Unit B
- 71 Nicholas Rd Unit H
- 24 Pinewood Dr
- 8 Clara Rd
- 8 Elm St Unit 8A
- 30 Edith Rd
- 10 Victoria Garden Unit A
- 1376 Concord St
- 53 Davidson Rd
- 11 Danforth Park Rd
- 111 Higgins Rd
- 33 Highgate Rd
- 182 Summer St
- 74 Brookfield Cir
- 71 Simpson Dr
- 73 Simpson Dr
- 4 David Rd
- 51 Riverview Rd
- 82 Brookfield Cir
- 70 Brookfield Cir
- 75 Simpson Dr
- 47 Riverview Rd
- 3 David Rd
- 3 David Rd
- 3 David Rd Unit 3
- 6 David Rd
- 47 Brookfield Cir
- 86 Brookfield Cir
- 66 Brookfield Cir
- 74 Simpson Dr
- 79 Simpson Dr
- 70 Simpson Dr
- 41 Riverview Rd