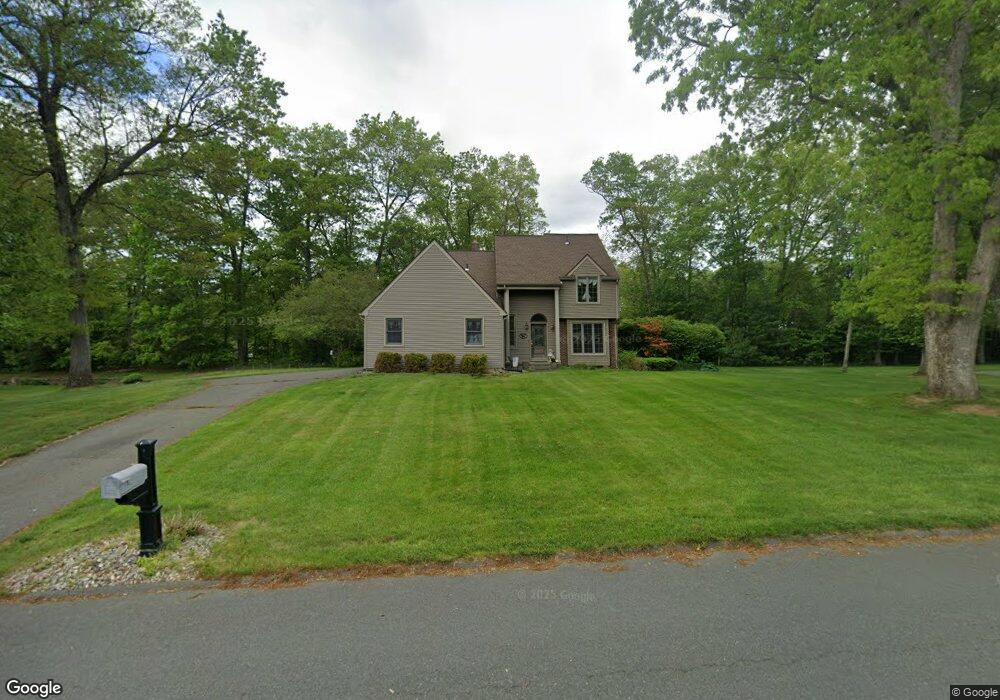
78 Christopher Dr Westfield, MA 01085
Estimated Value: $454,000 - $582,000
About This Home
This home is located at 78 Christopher Dr, Westfield, MA 01085 and is currently estimated at $499,712, approximately $277 per square foot. 78 Christopher Dr is a home located in Hampden County with nearby schools including Westfield High School and Saint Mary High School.
Ownership History
We collect this data history from publicly available records. To have your information removed, we recommend requesting removal directly through your county’s website.
Purchase Details
Home Financials for this Owner
Home Financials are based on the most recent Mortgage that was taken out on this home.Purchase Details
Home Values in the Area
Average Home Value in this Area
Purchase History
We collect this data history from publicly available records. To have your information removed, we recommend requesting removal directly through your county’s website.
| Date | Buyer | Sale Price | Title Company |
|---|---|---|---|
| $165,000 | -- | ||
| $185,000 | -- |
Mortgage History
We collect this data history from publicly available records. To have your information removed, we recommend requesting removal directly through your county’s website.
| Date | Status | Borrower | Loan Amount |
|---|---|---|---|
| Open | $15,000 | ||
| Open | $133,000 | ||
| Closed | $132,000 |
Tax History
We collect this data history from publicly available records. To have your information removed, we recommend requesting removal directly through your county’s website.
| Year | Tax Paid | Tax Assessment Tax Assessment Total Assessment is a certain percentage of the fair market value that is determined by local assessors to be the total taxable value of land and additions on the property. | Land | Improvement |
|---|---|---|---|---|
| 2025 | $6,171 | $406,500 | $128,800 | $277,700 |
| 2024 | $6,180 | $387,000 | $117,100 | $269,900 |
| 2023 | $6,068 | $370,900 | $111,600 | $259,300 |
| 2022 | $6,068 | $328,200 | $99,600 | $228,600 |
| 2021 | $5,883 | $311,600 | $93,700 | $217,900 |
| 2020 | $5,781 | $300,300 | $93,700 | $206,600 |
| 2019 | $5,653 | $287,400 | $89,200 | $198,200 |
| 2018 | $5,564 | $287,400 | $89,200 | $198,200 |
| 2017 | $5,447 | $280,500 | $90,700 | $189,800 |
| 2016 | $5,453 | $280,500 | $90,700 | $189,800 |
| 2015 | $4,969 | $268,000 | $90,700 | $177,300 |
| 2014 | $3,718 | $268,000 | $90,700 | $177,300 |
Map
- 242 Eastwood Dr
- 69 Rachael Terrace
- 46 Gloria Dr
- 34 Gloria Dr
- 27 Sherwood Ave
- 30 Cara Ln
- 0 E Mountain Rd
- 189 Springfield Rd Unit 2
- 0 Feeding Hills Rd
- 326 Dewey St
- 514 Dewey St
- 155 Main St
- 83 Pineridge Dr
- 138 Main St Unit 9
- 145 Main St
- 21 South St
- 151 Meadow St
- 24 Old Feeding Hills Rd
- 31 Shaker Rd
- 71 Notre Dame St
- 84 Christopher Dr
- 72 Christopher Dr
- 74 Joseph Ave
- 78 Joseph Ave
- 77 Christopher Dr
- 83 Christopher Dr
- 68 Joseph Ave
- 87 Christopher Dr
- 88 Christopher Dr
- 62 Joseph Ave
- 71 Christopher Dr
- 66 Christopher Dr
- 86 Joseph Ave
- 93 Christopher Dr
- 75 Joseph Ave
- 11 Amy Dr
- 92 Christopher Dr
- 69 Joseph Ave
- 79 Joseph Ave
- 65 Christopher Dr
Ask me questions while you tour the home.