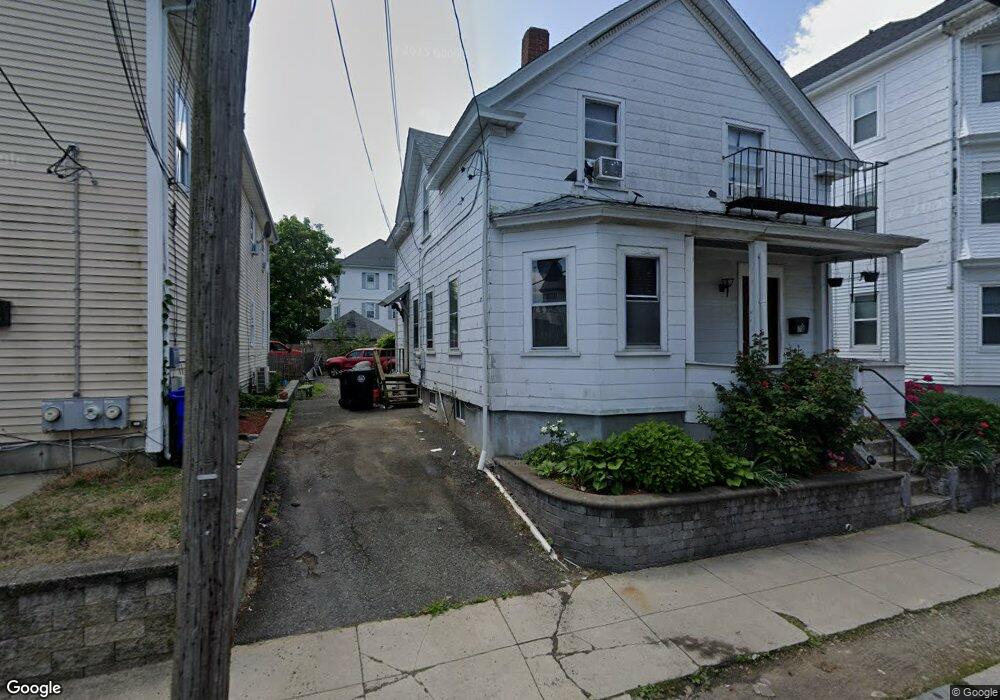
78 Clarence St Providence, RI 02909
Silver Lake NeighborhoodEstimated Value: $358,640 - $541,000
4
Beds
2
Baths
1,408
Sq Ft
$328/Sq Ft
Est. Value
About This Home
This home is located at 78 Clarence St, Providence, RI 02909 and is currently estimated at $462,160, approximately $328 per square foot. 78 Clarence St is a home located in Providence County with nearby schools including Asa Messer Elementary School, Charles N. Fortes Elementary School, and Laurel Hill Annex School.
Ownership History
Date
Name
Owned For
Owner Type
Purchase Details
Closed on
Feb 10, 2023
Sold by
Salazar Brenda A and Perez Sayra D
Bought by
Salazar Brenda A
Current Estimated Value
Purchase Details
Closed on
Jun 24, 2014
Sold by
Vista Ventures Llc and Providence City Of
Bought by
Ne Properties Inc
Purchase Details
Closed on
Mar 11, 2011
Sold by
Wells Fargo Bk
Bought by
Ne Props Inc
Home Financials for this Owner
Home Financials are based on the most recent Mortgage that was taken out on this home.
Original Mortgage
$79,900
Interest Rate
4.83%
Mortgage Type
Purchase Money Mortgage
Purchase Details
Closed on
Oct 27, 2010
Sold by
Estman Robert W and Wells Fargo Bk
Bought by
Wells Fargo Bk
Create a Home Valuation Report for This Property
The Home Valuation Report is an in-depth analysis detailing your home's value as well as a comparison with similar homes in the area
Home Values in the Area
Average Home Value in this Area
Purchase History
| Date | Buyer | Sale Price | Title Company |
|---|---|---|---|
| Salazar Brenda A | -- | None Available | |
| Ne Properties Inc | $3,930 | -- | |
| Ne Props Inc | $49,900 | -- | |
| Wells Fargo Bk | $55,000 | -- |
Source: Public Records
Mortgage History
| Date | Status | Borrower | Loan Amount |
|---|---|---|---|
| Previous Owner | Wells Fargo Bk | $108,007 | |
| Previous Owner | Wells Fargo Bk | $79,900 | |
| Previous Owner | Wells Fargo Bk | $68,750 | |
| Previous Owner | Wells Fargo Bk | $40,000 |
Source: Public Records
Tax History Compared to Growth
Tax History
| Year | Tax Paid | Tax Assessment Tax Assessment Total Assessment is a certain percentage of the fair market value that is determined by local assessors to be the total taxable value of land and additions on the property. | Land | Improvement |
|---|---|---|---|---|
| 2025 | $2,482 | $328,700 | $128,000 | $200,700 |
| 2024 | $3,887 | $211,800 | $72,000 | $139,800 |
| 2023 | $3,887 | $211,800 | $72,000 | $139,800 |
| 2022 | $3,770 | $211,800 | $72,000 | $139,800 |
| 2021 | $3,117 | $126,900 | $45,800 | $81,100 |
| 2020 | $3,117 | $126,900 | $45,800 | $81,100 |
| 2019 | $3,117 | $126,900 | $45,800 | $81,100 |
| 2018 | $3,103 | $97,100 | $44,400 | $52,700 |
| 2017 | $3,103 | $97,100 | $44,400 | $52,700 |
| 2016 | $3,103 | $97,100 | $44,400 | $52,700 |
| 2015 | $3,158 | $95,400 | $47,100 | $48,300 |
| 2014 | $3,220 | $95,400 | $47,100 | $48,300 |
| 2013 | $3,220 | $95,400 | $47,100 | $48,300 |
Source: Public Records
Map
Nearby Homes
- 80 Clarence St
- 80 Clarence St Unit 2
- 72 Clarence St
- 84 Clarence St
- 68 Clarence St
- 79 Clarence St
- 67 Wallace St
- 67 Wallace St Unit 1
- 86 Clarence St
- 71 Wallace St
- 69 Wallace St Unit 3
- 65 Wallace St
- 71 Clarence St Unit 73
- 64 Clarence St
- 75 Wallace St
- 75 Clarence St
- 59 Wallace St
- 77 Clarence St
- 81 Clarence St
- 94 Clarence St