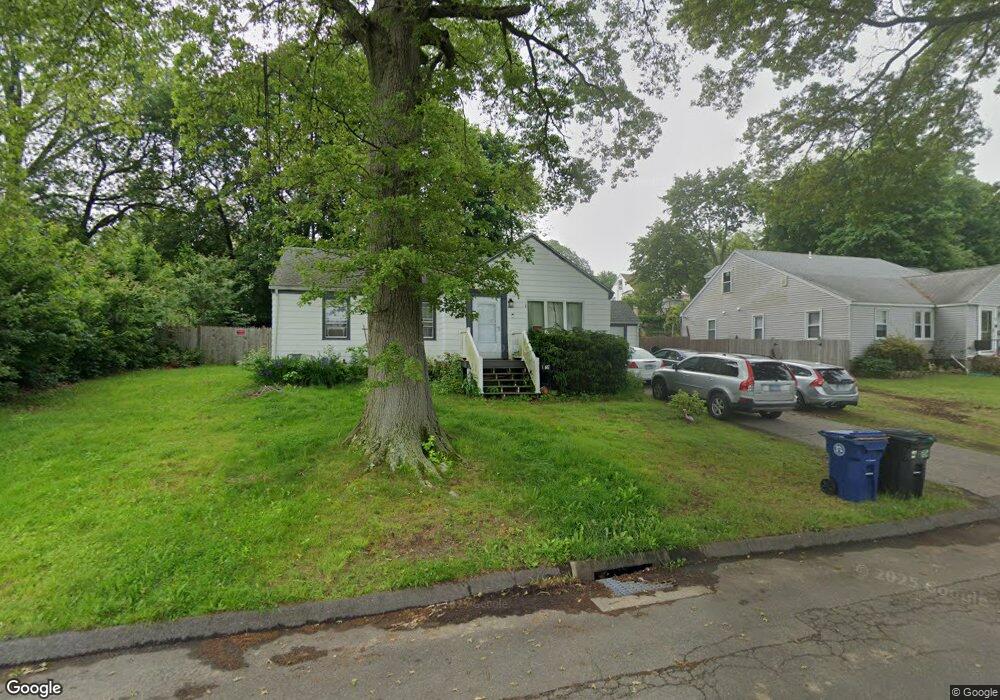
78 Cooper Rd West Haven, CT 06516
West Shore NeighborhoodEstimated Value: $286,000 - $417,000
3
Beds
1
Bath
964
Sq Ft
$371/Sq Ft
Est. Value
About This Home
This home is located at 78 Cooper Rd, West Haven, CT 06516 and is currently estimated at $357,452, approximately $370 per square foot. 78 Cooper Rd is a home located in New Haven County with nearby schools including Carrigan 5/6 Intermediate School, Harry M. Bailey Middle School, and West Haven High School.
Ownership History
Date
Name
Owned For
Owner Type
Purchase Details
Closed on
Oct 13, 2000
Sold by
Mannion John J and Mannion Barbara A
Bought by
Cooper Gary A and Weber Catherine M
Current Estimated Value
Home Financials for this Owner
Home Financials are based on the most recent Mortgage that was taken out on this home.
Original Mortgage
$237,600
Outstanding Balance
$86,464
Interest Rate
7.89%
Mortgage Type
Purchase Money Mortgage
Estimated Equity
$270,988
Create a Home Valuation Report for This Property
The Home Valuation Report is an in-depth analysis detailing your home's value as well as a comparison with similar homes in the area
Home Values in the Area
Average Home Value in this Area
Purchase History
| Date | Buyer | Sale Price | Title Company |
|---|---|---|---|
| Cooper Gary A | $297,000 | -- | |
| Cooper Gary A | $297,000 | -- |
Source: Public Records
Mortgage History
| Date | Status | Borrower | Loan Amount |
|---|---|---|---|
| Open | Cooper Gary A | $237,600 | |
| Closed | Cooper Gary A | $237,600 | |
| Previous Owner | Cooper Gary A | $60,000 | |
| Previous Owner | Cooper Gary A | $51,000 |
Source: Public Records
Tax History Compared to Growth
Tax History
| Year | Tax Paid | Tax Assessment Tax Assessment Total Assessment is a certain percentage of the fair market value that is determined by local assessors to be the total taxable value of land and additions on the property. | Land | Improvement |
|---|---|---|---|---|
| 2025 | $6,456 | $196,420 | $87,430 | $108,990 |
| 2024 | $5,868 | $125,230 | $60,550 | $64,680 |
| 2023 | $5,648 | $125,230 | $60,550 | $64,680 |
| 2022 | $5,546 | $125,230 | $60,550 | $64,680 |
| 2021 | $5,546 | $125,230 | $60,550 | $64,680 |
| 2020 | $5,570 | $114,590 | $55,720 | $58,870 |
| 2019 | $5,392 | $114,590 | $55,720 | $58,870 |
| 2018 | $5,316 | $114,590 | $55,720 | $58,870 |
| 2017 | $5,173 | $114,590 | $55,720 | $58,870 |
| 2016 | $5,115 | $114,590 | $55,720 | $58,870 |
| 2015 | $4,975 | $124,740 | $59,850 | $64,890 |
| 2014 | $4,975 | $124,740 | $59,850 | $64,890 |
Source: Public Records
Map
Nearby Homes