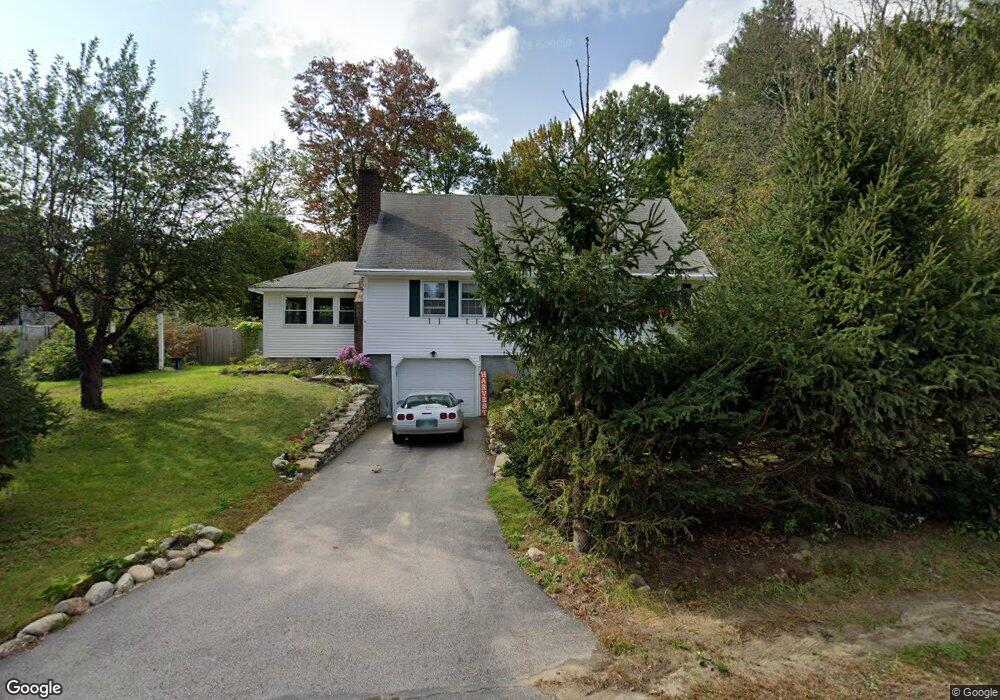
78 Crosby St Unit 39/24 Milford, NH 03055
Estimated Value: $489,951 - $509,000
3
Beds
3
Baths
1,925
Sq Ft
$261/Sq Ft
Est. Value
About This Home
This home is located at 78 Crosby St Unit 39/24, Milford, NH 03055 and is currently estimated at $502,488, approximately $261 per square foot. 78 Crosby St Unit 39/24 is a home located in Hillsborough County with nearby schools including Jacques Memorial Elementary School, Heron Pond Elementary School, and Milford Middle School.
Ownership History
Date
Name
Owned For
Owner Type
Purchase Details
Closed on
Jan 19, 2022
Sold by
Perrine Randall K
Bought by
Greene Jennifer and Greene Michael I
Current Estimated Value
Home Financials for this Owner
Home Financials are based on the most recent Mortgage that was taken out on this home.
Original Mortgage
$294,060
Outstanding Balance
$269,902
Interest Rate
3.11%
Mortgage Type
Purchase Money Mortgage
Estimated Equity
$232,586
Purchase Details
Closed on
Nov 15, 2019
Sold by
Fred R Ross Ft
Bought by
Perrine Randy
Home Financials for this Owner
Home Financials are based on the most recent Mortgage that was taken out on this home.
Original Mortgage
$260,988
Interest Rate
3.62%
Mortgage Type
FHA
Purchase Details
Closed on
Jul 9, 2013
Sold by
Ross Fred R
Bought by
Fred R Ross Ft and Ross
Purchase Details
Closed on
Apr 26, 2013
Sold by
Fred R Ross Ft and Ross
Bought by
Ross Fred R
Purchase Details
Closed on
Sep 23, 1971
Bought by
Fred R Ross Ft
Create a Home Valuation Report for This Property
The Home Valuation Report is an in-depth analysis detailing your home's value as well as a comparison with similar homes in the area
Home Values in the Area
Average Home Value in this Area
Purchase History
| Date | Buyer | Sale Price | Title Company |
|---|---|---|---|
| Greene Jennifer | $390,000 | None Available | |
| Perrine Randy | $270,000 | -- | |
| Fred R Ross Ft | -- | -- | |
| Fred R Ross Ft | -- | -- | |
| Ross Fred R | -- | -- | |
| Fred R Ross Ret | -- | -- | |
| Ross Fred R | -- | -- | |
| Fred R Ross Ret | -- | -- | |
| Fred R Ross Ft | -- | -- |
Source: Public Records
Mortgage History
| Date | Status | Borrower | Loan Amount |
|---|---|---|---|
| Open | Greene Jennifer | $294,060 | |
| Previous Owner | Perrine Randy | $260,988 |
Source: Public Records
Tax History Compared to Growth
Tax History
| Year | Tax Paid | Tax Assessment Tax Assessment Total Assessment is a certain percentage of the fair market value that is determined by local assessors to be the total taxable value of land and additions on the property. | Land | Improvement |
|---|---|---|---|---|
| 2024 | $6,994 | $295,500 | $82,000 | $213,500 |
| 2023 | $6,551 | $295,500 | $82,000 | $213,500 |
| 2022 | $5,790 | $278,500 | $82,000 | $196,500 |
| 2021 | $5,559 | $275,900 | $82,000 | $193,900 |
| 2020 | $6,218 | $245,100 | $58,500 | $186,600 |
| 2019 | $6,365 | $245,100 | $58,500 | $186,600 |
| 2018 | $5,609 | $199,600 | $57,500 | $142,100 |
| 2017 | $5,060 | $199,600 | $57,500 | $142,100 |
| 2016 | $5,780 | $199,600 | $57,500 | $142,100 |
| 2015 | $5,826 | $204,000 | $57,500 | $146,500 |
| 2014 | $5,569 | $204,000 | $57,500 | $146,500 |
| 2013 | $5,502 | $204,000 | $57,500 | $146,500 |
Source: Public Records
Map
Nearby Homes
- 0 Briar Cliff Dr
- 24 Spaulding St
- 32 Larch Rd
- 145 Westchester Dr
- 61 W Meadow Ct
- 43 Boxwood Cir
- 344 Elm St Unit 14
- 344 Elm St Unit 16
- 44 Osgood Rd
- 229 Mont Vernon Rd
- 57 Patch Hill Ln
- 40 North St
- 131 Homestead Cir
- 26 Melendy Rd Unit 97
- 26 Melendy Rd Unit 42
- 377 Nashua St
- 64 Lyndeborough Rd
- 51 Singer Brook Rd
- 0 Claude Rd
- 294 Mason Rd