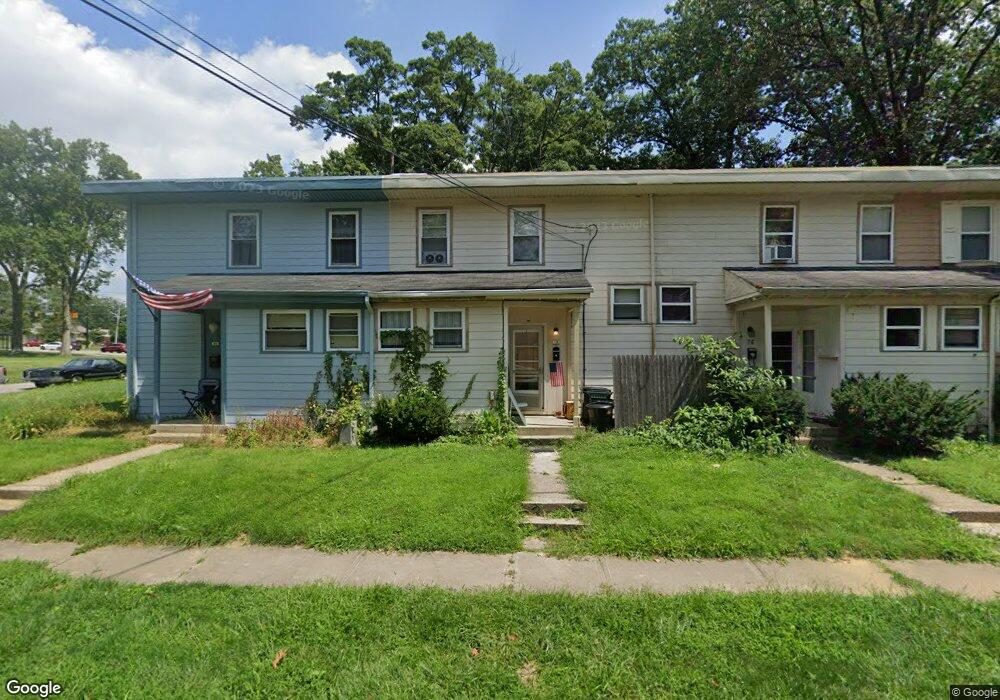
78 Drummond St Cincinnati, OH 45218
Estimated Value: $88,000 - $141,000
2
Beds
1
Bath
956
Sq Ft
$120/Sq Ft
Est. Value
About This Home
This home is located at 78 Drummond St, Cincinnati, OH 45218 and is currently estimated at $115,073, approximately $120 per square foot. 78 Drummond St is a home located in Hamilton County with nearby schools including Central Montessori Academy.
Ownership History
Date
Name
Owned For
Owner Type
Purchase Details
Closed on
Jan 31, 2023
Sold by
Striker David and Striker Linda
Bought by
Stahl Kamryn J
Current Estimated Value
Home Financials for this Owner
Home Financials are based on the most recent Mortgage that was taken out on this home.
Original Mortgage
$80,750
Outstanding Balance
$77,827
Interest Rate
6.27%
Mortgage Type
New Conventional
Estimated Equity
$37,246
Purchase Details
Closed on
Dec 22, 2021
Sold by
Five-O-Property Investment Group
Bought by
Striker David
Purchase Details
Closed on
Jul 18, 2000
Sold by
Wiggins Nancy A
Bought by
Five O Property Investment Group
Home Financials for this Owner
Home Financials are based on the most recent Mortgage that was taken out on this home.
Original Mortgage
$39,750
Interest Rate
8.31%
Purchase Details
Closed on
Jun 24, 1995
Sold by
Wiggins Cynthia M
Bought by
Wiggins Nancy A
Purchase Details
Closed on
Nov 22, 1994
Sold by
Pfankuch Frieda K
Bought by
Wiggins Nancy A and Wiggins Cynthia M
Create a Home Valuation Report for This Property
The Home Valuation Report is an in-depth analysis detailing your home's value as well as a comparison with similar homes in the area
Home Values in the Area
Average Home Value in this Area
Purchase History
| Date | Buyer | Sale Price | Title Company |
|---|---|---|---|
| Stahl Kamryn J | $65,000 | -- | |
| Striker David | -- | Leo Grote Lpa | |
| Five O Property Investment Group | $41,500 | -- | |
| Wiggins Nancy A | -- | -- | |
| Wiggins Nancy A | -- | -- |
Source: Public Records
Mortgage History
| Date | Status | Borrower | Loan Amount |
|---|---|---|---|
| Open | Stahl Kamryn J | $80,750 | |
| Previous Owner | Five O Property Investment Group | $39,750 |
Source: Public Records
Tax History
| Year | Tax Paid | Tax Assessment Tax Assessment Total Assessment is a certain percentage of the fair market value that is determined by local assessors to be the total taxable value of land and additions on the property. | Land | Improvement |
|---|---|---|---|---|
| 2025 | $2,145 | $29,751 | $5,128 | $24,623 |
| 2024 | $1,977 | $29,751 | $5,128 | $24,623 |
| 2023 | $1,848 | $29,751 | $5,128 | $24,623 |
| 2022 | $1,344 | $15,548 | $4,281 | $11,267 |
| 2021 | $1,344 | $15,548 | $4,281 | $11,267 |
| 2020 | $1,328 | $15,548 | $4,281 | $11,267 |
| 2019 | $1,298 | $13,287 | $3,658 | $9,629 |
| 2018 | $1,300 | $13,287 | $3,658 | $9,629 |
| 2017 | $1,224 | $13,287 | $3,658 | $9,629 |
| 2016 | $646 | $6,710 | $4,074 | $2,636 |
| 2015 | $601 | $6,710 | $4,074 | $2,636 |
| 2014 | $614 | $6,710 | $4,074 | $2,636 |
| 2013 | $1,405 | $15,992 | $4,200 | $11,792 |
Source: Public Records
Map
Nearby Homes
Your Personal Tour Guide
Ask me questions while you tour the home.