Estimated Value: $518,000 - $569,000
4
Beds
2
Baths
1,596
Sq Ft
$345/Sq Ft
Est. Value
About This Home
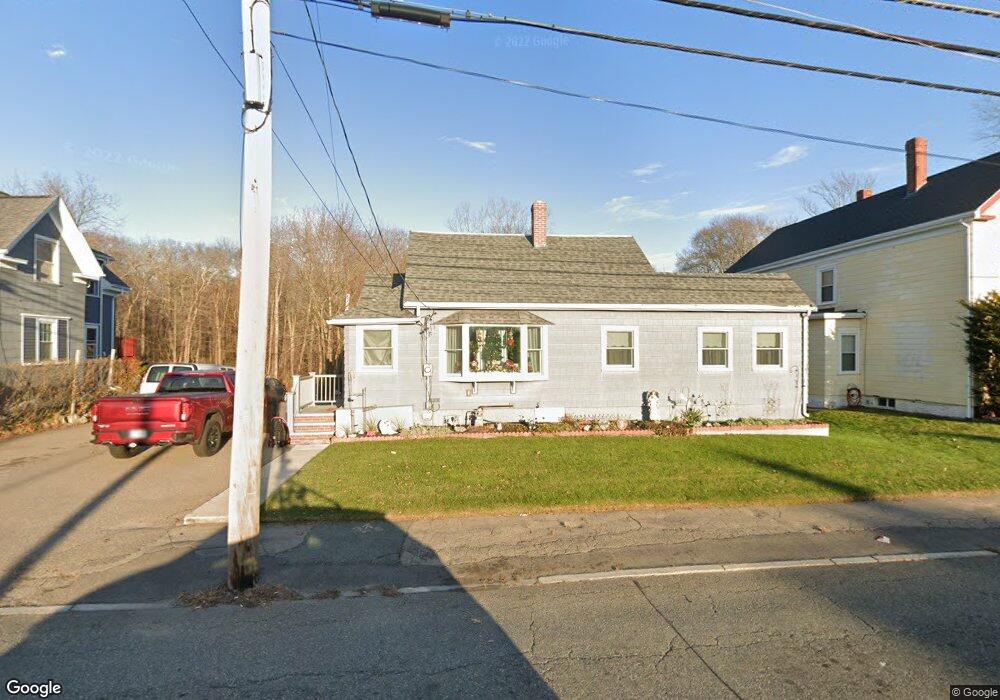
This home is located at 78 E Main St, Avon, MA 02322 and is currently estimated at $550,194, approximately $344 per square foot. 78 E Main St is a home located in Norfolk County with nearby schools including Ralph D. Butler Elementary School and Avon Middle/High School.
Ownership History
Date
Name
Owned For
Owner Type
Purchase Details
Closed on
Dec 31, 2009
Sold by
Dell Robert and Dell Esther
Bought by
Melchionno Tina A
Current Estimated Value
Home Financials for this Owner
Home Financials are based on the most recent Mortgage that was taken out on this home.
Original Mortgage
$176,800
Outstanding Balance
$115,489
Interest Rate
4.85%
Mortgage Type
Purchase Money Mortgage
Estimated Equity
$434,705
Create a Home Valuation Report for This Property
The Home Valuation Report is an in-depth analysis detailing your home's value as well as a comparison with similar homes in the area
Home Values in the Area
Average Home Value in this Area
Purchase History
| Date | Buyer | Sale Price | Title Company |
|---|---|---|---|
| Melchionno Tina A | $221,000 | -- |
Source: Public Records
Mortgage History
| Date | Status | Borrower | Loan Amount |
|---|---|---|---|
| Open | Melchionno Tina A | $176,800 |
Source: Public Records
Tax History Compared to Growth
Tax History
| Year | Tax Paid | Tax Assessment Tax Assessment Total Assessment is a certain percentage of the fair market value that is determined by local assessors to be the total taxable value of land and additions on the property. | Land | Improvement |
|---|---|---|---|---|
| 2025 | $54 | $405,700 | $175,900 | $229,800 |
| 2024 | $4,969 | $354,200 | $157,400 | $196,800 |
| 2023 | $4,824 | $354,200 | $157,400 | $196,800 |
| 2022 | $4,825 | $305,200 | $131,200 | $174,000 |
| 2021 | $4,537 | $270,400 | $119,100 | $151,300 |
| 2020 | $5,021 | $283,700 | $115,400 | $168,300 |
| 2019 | $4,537 | $252,200 | $103,200 | $149,000 |
| 2018 | $4,678 | $252,200 | $103,200 | $149,000 |
| 2017 | $3,805 | $220,200 | $103,200 | $117,000 |
| 2016 | $3,860 | $225,600 | $106,200 | $119,400 |
| 2015 | $3,451 | $210,800 | $106,200 | $104,600 |
Source: Public Records
Map
Nearby Homes