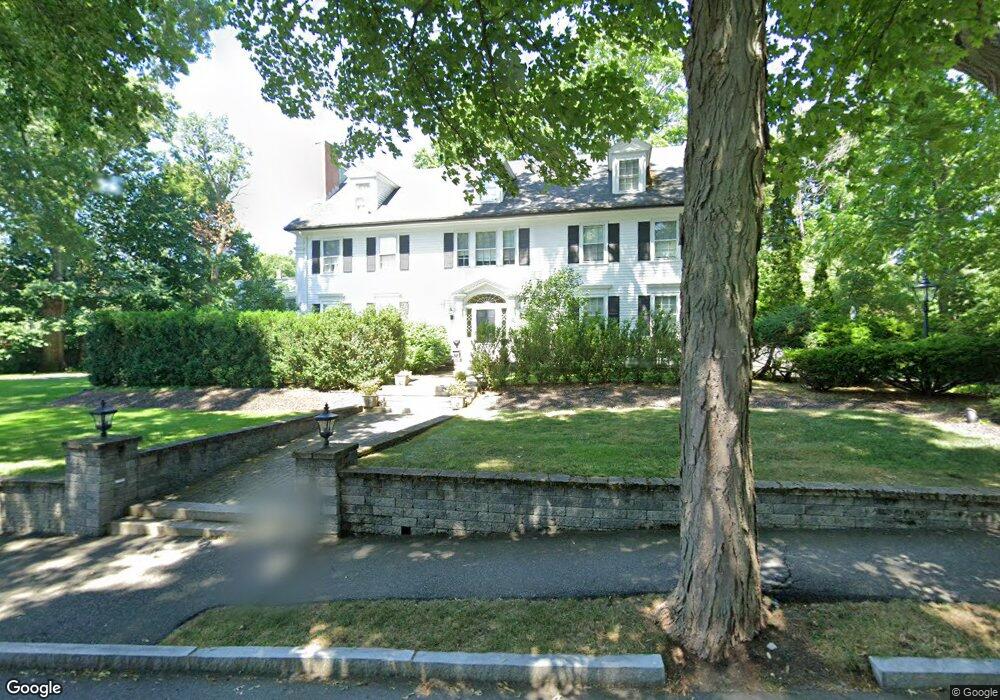
78 Farlow Rd Newton, MA 02458
Newton Corner NeighborhoodEstimated Value: $2,407,000 - $3,536,000
5
Beds
2
Baths
4,428
Sq Ft
$650/Sq Ft
Est. Value
About This Home
This home is located at 78 Farlow Rd, Newton, MA 02458 and is currently estimated at $2,879,102, approximately $650 per square foot. 78 Farlow Rd is a home located in Middlesex County with nearby schools including Ward Elementary School, Underwood Elementary School, and Bigelow Middle School.
Ownership History
Date
Name
Owned For
Owner Type
Purchase Details
Closed on
Dec 2, 1991
Sold by
78 Farlow Rd T
Bought by
Niaraki Mahmood A and Fadiani Faeze
Current Estimated Value
Home Financials for this Owner
Home Financials are based on the most recent Mortgage that was taken out on this home.
Original Mortgage
$400,000
Interest Rate
8.72%
Mortgage Type
Purchase Money Mortgage
Create a Home Valuation Report for This Property
The Home Valuation Report is an in-depth analysis detailing your home's value as well as a comparison with similar homes in the area
Home Values in the Area
Average Home Value in this Area
Purchase History
| Date | Buyer | Sale Price | Title Company |
|---|---|---|---|
| Niaraki Mahmood A | $740,000 | -- |
Source: Public Records
Mortgage History
| Date | Status | Borrower | Loan Amount |
|---|---|---|---|
| Closed | Niaraki Mahmood A | $470,000 | |
| Closed | Niaraki Mahmood A | $400,000 |
Source: Public Records
Tax History Compared to Growth
Tax History
| Year | Tax Paid | Tax Assessment Tax Assessment Total Assessment is a certain percentage of the fair market value that is determined by local assessors to be the total taxable value of land and additions on the property. | Land | Improvement |
|---|---|---|---|---|
| 2025 | $28,076 | $2,864,900 | $1,656,200 | $1,208,700 |
| 2024 | $27,147 | $2,781,500 | $1,608,000 | $1,173,500 |
| 2023 | $26,048 | $2,558,700 | $1,268,500 | $1,290,200 |
| 2022 | $24,924 | $2,369,200 | $1,174,500 | $1,194,700 |
| 2021 | $24,050 | $2,235,100 | $1,108,000 | $1,127,100 |
| 2020 | $23,334 | $2,235,100 | $1,108,000 | $1,127,100 |
| 2019 | $22,677 | $2,170,000 | $1,075,700 | $1,094,300 |
| 2018 | $21,986 | $2,032,000 | $958,600 | $1,073,400 |
| 2017 | $21,317 | $1,917,000 | $904,300 | $1,012,700 |
| 2016 | $20,388 | $1,791,600 | $845,100 | $946,500 |
| 2015 | $19,440 | $1,674,400 | $789,800 | $884,600 |
Source: Public Records
Map
Nearby Homes
- 106 Farlow Rd
- 206 Franklin St
- 21 Glenley Terrace
- 121 Tremont St Unit B1
- 99 Tremont St Unit 105
- 99 Tremont St Unit 413
- 59 Hyde Ave
- 8 Tremont Place
- 642 Centre St
- 70 Washington St Unit 70
- 70 Washington St
- 35 George St Unit 35
- 37 George St Unit 37
- 142 Kenrick St Unit 36
- 686 Centre St
- 548 Centre St Unit 5
- 67 Algonquin Rd
- 68 Vernon St
- 18 Breck Ave Unit 18
- 116 Lake Shore Rd Unit 4
- 38 Beechcroft Rd
- 88 Farlow Rd
- 30 Beechcroft Rd
- 56 Farlow Rd
- 20 Beechcroft Rd
- 69 Farlow Rd
- 14 Huntington Rd
- 96 Farlow Rd
- 55 Farlow Rd
- 33 Beechcroft Rd Unit 37
- 37 Beechcroft Rd
- 12 Beechcroft Rd
- 25 Beechcroft Rd
- 49 Farlow Rd
- 32 Farlow Rd
- 30 Huntington Rd
- 331 Kenrick St
- 337 Kenrick St
- 25 Huntington Rd
- 11 Beechcroft Rd