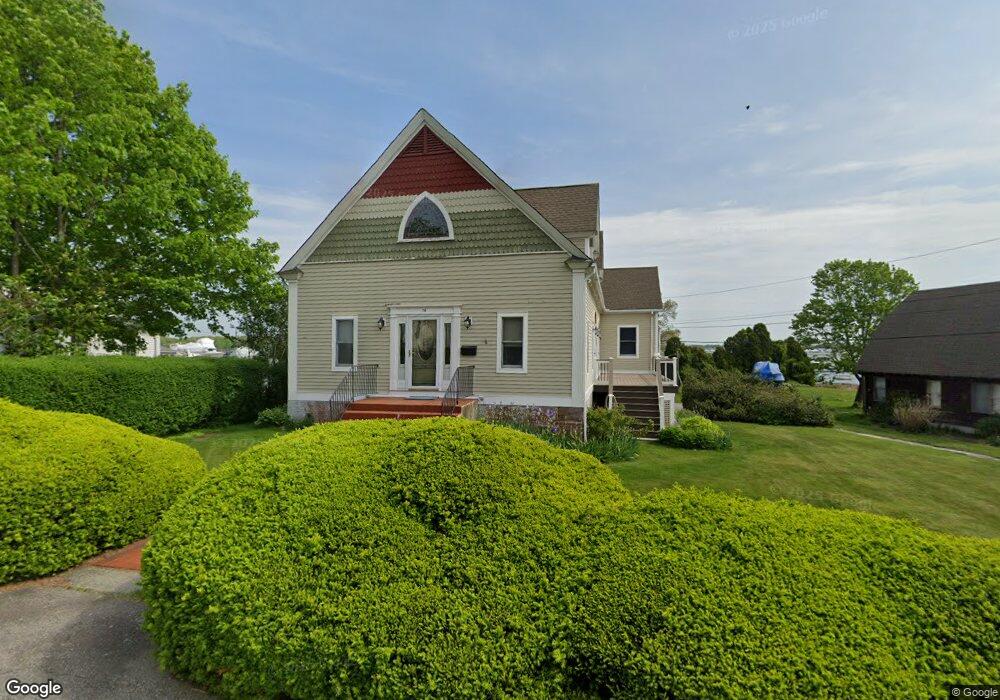
78 Front St Groton, CT 06340
Noank NeighborhoodEstimated Value: $1,039,000 - $1,448,000
2
Beds
4
Baths
1,500
Sq Ft
$798/Sq Ft
Est. Value
About This Home
This apartment has beautiful, covered decks where you can look down the Mystic River and enjoy a private moment or a peaceful meal. It is a second floor apartment with 1500 sq ft, of space, 2 bedrooms, 1 bath, kitchen, large dining living room area, and includes Heat, A/C, Electricity, has an available washer/dryer, new kitchen appliances. The location is in the quiet of Noank, CT. On this property there is no smoking or animals.
Ownership History
Date
Name
Owned For
Owner Type
Purchase Details
Closed on
Aug 16, 2018
Sold by
Densmore Joyce
Bought by
Joyce Densmore Lt
Current Estimated Value
Purchase Details
Closed on
Jan 14, 1988
Sold by
St Joseph Church
Bought by
Densmore Mark
Create a Home Valuation Report for This Property
The Home Valuation Report is an in-depth analysis detailing your home's value as well as a comparison with similar homes in the area
Home Values in the Area
Average Home Value in this Area
Purchase History
| Date | Buyer | Sale Price | Title Company |
|---|---|---|---|
| Joyce Densmore Lt | -- | -- | |
| Densmore Mark | $310,000 | -- |
Source: Public Records
Mortgage History
| Date | Status | Borrower | Loan Amount |
|---|---|---|---|
| Previous Owner | Densmore Mark | $182,000 | |
| Previous Owner | Densmore Mark | $281,400 |
Source: Public Records
Property History
| Date | Event | Price | List to Sale | Price per Sq Ft |
|---|---|---|---|---|
| 10/08/2024 10/08/24 | Off Market | $2,500 | -- | -- |
| 09/01/2024 09/01/24 | For Rent | $2,500 | -- | -- |
Tax History Compared to Growth
Tax History
| Year | Tax Paid | Tax Assessment Tax Assessment Total Assessment is a certain percentage of the fair market value that is determined by local assessors to be the total taxable value of land and additions on the property. | Land | Improvement |
|---|---|---|---|---|
| 2025 | $14,780 | $560,280 | $341,985 | $218,295 |
| 2024 | $13,800 | $560,280 | $341,985 | $218,295 |
| 2023 | $13,228 | $560,280 | $248,430 | $311,850 |
| 2022 | $12,959 | $560,280 | $248,430 | $311,850 |
| 2021 | $11,509 | $416,080 | $216,020 | $200,060 |
| 2020 | $11,291 | $418,950 | $216,020 | $202,930 |
| 2019 | $10,780 | $418,950 | $216,020 | $202,930 |
| 2018 | $10,708 | $418,950 | $216,020 | $202,930 |
| 2017 | $10,524 | $418,950 | $216,020 | $202,930 |
| 2016 | $10,578 | $455,560 | $270,620 | $184,940 |
| 2015 | $10,177 | $455,560 | $270,620 | $184,940 |
| 2014 | $9,918 | $455,560 | $270,620 | $184,940 |
Source: Public Records
Map
Nearby Homes