Estimated Value: $1,730,000 - $1,849,585
3
Beds
3
Baths
1,720
Sq Ft
$1,036/Sq Ft
Est. Value
About This Home
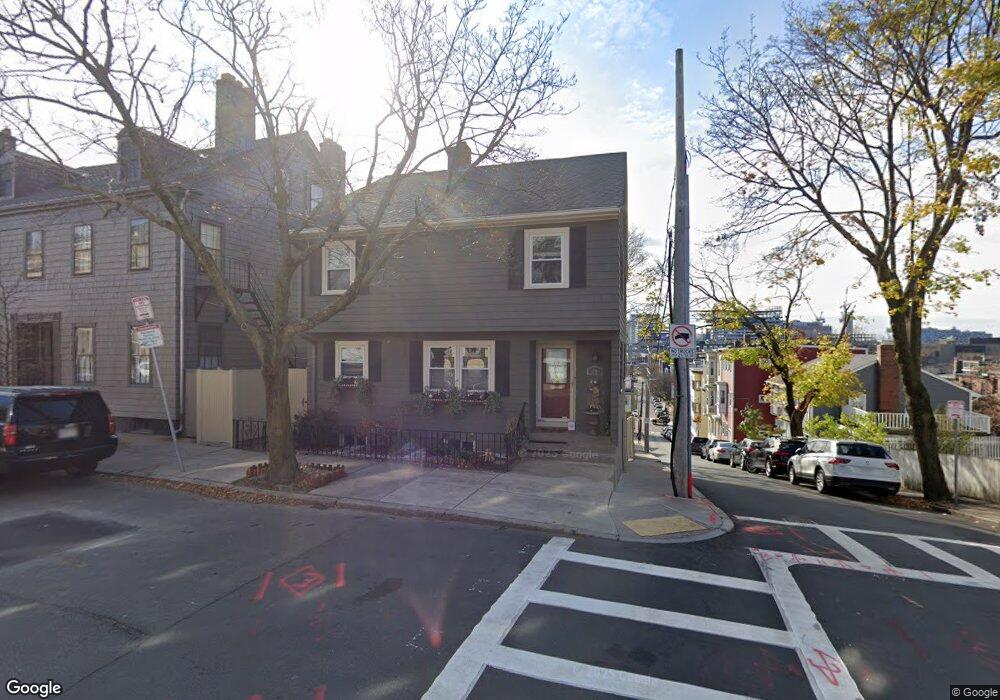
This home is located at 78 High St, Charlestown, MA 02129 and is currently estimated at $1,781,146, approximately $1,035 per square foot. 78 High St is a home located in Suffolk County with nearby schools including Community Charter School of Cambridge and Torit Montessori School.
Ownership History
Date
Name
Owned For
Owner Type
Purchase Details
Closed on
Aug 28, 2025
Sold by
Fleming Brian and Fleming Katherine
Bought by
Plaisted Stephen and Phillips Katherine
Current Estimated Value
Home Financials for this Owner
Home Financials are based on the most recent Mortgage that was taken out on this home.
Original Mortgage
$17,601,000
Outstanding Balance
$17,570,607
Interest Rate
6.75%
Mortgage Type
New Conventional
Estimated Equity
-$15,789,461
Purchase Details
Closed on
Jun 18, 2021
Sold by
Daniely Debra B
Bought by
Fleming Brian and Fleming Katherine
Home Financials for this Owner
Home Financials are based on the most recent Mortgage that was taken out on this home.
Original Mortgage
$724,500
Interest Rate
2.9%
Mortgage Type
Purchase Money Mortgage
Purchase Details
Closed on
Sep 24, 2020
Sold by
Debra D Borgwardt Ret and Borgwardt
Bought by
Daniely Debra B
Home Financials for this Owner
Home Financials are based on the most recent Mortgage that was taken out on this home.
Original Mortgage
$518,000
Interest Rate
2.38%
Mortgage Type
Adjustable Rate Mortgage/ARM
Purchase Details
Closed on
Jul 24, 2018
Sold by
Borgwardt Debra D
Bought by
Debra D Borgwardt Ret and Borgwardt
Purchase Details
Closed on
Aug 19, 2015
Sold by
Daniely Sean and Daniely Debra D
Bought by
Daniely Debra B
Home Financials for this Owner
Home Financials are based on the most recent Mortgage that was taken out on this home.
Original Mortgage
$570,000
Interest Rate
3%
Mortgage Type
Adjustable Rate Mortgage/ARM
Purchase Details
Closed on
May 30, 2006
Sold by
First Chrch In Charles
Bought by
Borgwardt Debra D and Daniely Sean
Create a Home Valuation Report for This Property
The Home Valuation Report is an in-depth analysis detailing your home's value as well as a comparison with similar homes in the area
Home Values in the Area
Average Home Value in this Area
Purchase History
| Date | Buyer | Sale Price | Title Company |
|---|---|---|---|
| Plaisted Stephen | $2,200,000 | -- | |
| Plaisted Stephen | $2,200,000 | -- | |
| Fleming Brian | $1,560,000 | None Available | |
| Fleming Brian | $1,560,000 | None Available | |
| Daniely Debra B | -- | None Available | |
| Daniely Debra B | -- | None Available | |
| Debra D Borgwardt Ret | -- | -- | |
| Debra D Borgwardt Ret | -- | -- | |
| Daniely Debra B | -- | -- | |
| Daniely Debra B | -- | -- | |
| Borgwardt Debra D | $525,000 | -- | |
| Borgwardt Debra D | $525,000 | -- | |
| Borgwardt Debra D | $525,000 | -- |
Source: Public Records
Mortgage History
| Date | Status | Borrower | Loan Amount |
|---|---|---|---|
| Open | Plaisted Stephen | $17,601,000 | |
| Closed | Plaisted Stephen | $17,601,000 | |
| Previous Owner | Fleming Brian | $724,500 | |
| Previous Owner | Daniely Debra B | $518,000 | |
| Previous Owner | Daniely Debra B | $570,000 | |
| Previous Owner | Borgwardt Debra D | $125,000 |
Source: Public Records
Tax History Compared to Growth
Tax History
| Year | Tax Paid | Tax Assessment Tax Assessment Total Assessment is a certain percentage of the fair market value that is determined by local assessors to be the total taxable value of land and additions on the property. | Land | Improvement |
|---|---|---|---|---|
| 2025 | $17,384 | $1,501,200 | $560,000 | $941,200 |
| 2024 | $15,580 | $1,429,400 | $481,300 | $948,100 |
| 2023 | $13,396 | $1,247,300 | $458,400 | $788,900 |
| 2022 | $12,216 | $1,122,800 | $416,800 | $706,000 |
| 2021 | $11,746 | $1,100,800 | $408,600 | $692,200 |
| 2020 | $11,415 | $1,081,000 | $401,600 | $679,400 |
| 2019 | $11,166 | $1,059,400 | $321,300 | $738,100 |
| 2018 | $10,478 | $999,800 | $321,300 | $678,500 |
| 2017 | $9,800 | $925,400 | $321,300 | $604,100 |
| 2016 | $9,513 | $864,800 | $321,300 | $543,500 |
| 2015 | $8,630 | $712,600 | $255,700 | $456,900 |
| 2014 | -- | $672,900 | $255,700 | $417,200 |
Source: Public Records
Map
Nearby Homes
- 56 High St Unit 3
- 15 Russell St
- 9 Russell St Unit 2
- 9 Russell St Unit 1
- 46 High St
- 270 Bunker Hill St Unit 4
- 247 Bunker Hill St Unit A
- 255 Bunker Hill St Unit 2
- 29 Eden St Unit 3
- 64 Walker St Unit 66
- 207 Bunker Hill St Unit 2
- 172 Bunker Hill St Unit 1
- 40 Mead St Unit 3
- 1 Washington Place
- 254-256 Medford St Unit 2
- 56 Belmont St Unit 1
- 24 N Mead St
- 364 Bunker Hill St Unit 1
- 5 Wallace Ct
- 106 Bunker Hill St Unit 2
- 74 High St
- 74 High St Unit A
- 74 High St Unit 74
- 74 High St Unit 1
- 74 High St Unit 2
- 82 High St
- 15 School St
- 18 School St
- 72 High St
- 87 High St Unit 3
- 87 High St Unit 2
- 87 High St Unit 1
- 14 School St
- 14 School St Unit 2
- 14 School St Unit 1
- 14 School St Unit 3
- 86 High St
- 86 High St Unit 1
- 81 High St Unit 2
- 81 High St Unit 1