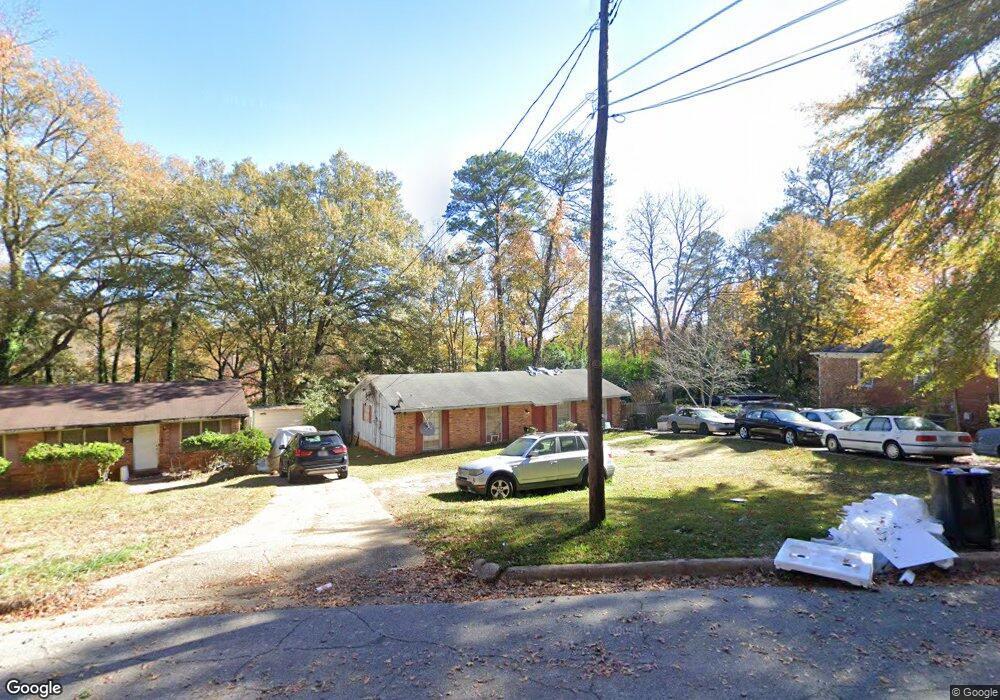
78 Lafayette Dr Columbus, GA 31903
Southern Columbus NeighborhoodEstimated Value: $99,000 - $131,000
4
Beds
3
Baths
1,450
Sq Ft
$79/Sq Ft
Est. Value
About This Home
This home is located at 78 Lafayette Dr, Columbus, GA 31903 and is currently estimated at $114,284, approximately $78 per square foot. 78 Lafayette Dr is a home located in Muscogee County with nearby schools including Glenallen Elementary School, Dorothy Height Elementary School, and Eddy Middle School.
Ownership History
Date
Name
Owned For
Owner Type
Purchase Details
Closed on
Apr 16, 2009
Sold by
Bo Dapa Realty Llc
Bought by
Houston Maruska
Current Estimated Value
Home Financials for this Owner
Home Financials are based on the most recent Mortgage that was taken out on this home.
Original Mortgage
$5,000
Outstanding Balance
$3,179
Interest Rate
5.05%
Mortgage Type
Unknown
Estimated Equity
$111,105
Purchase Details
Closed on
Oct 24, 2008
Sold by
Wachovia Mortgage Corporation
Bought by
Stamm Robert
Home Financials for this Owner
Home Financials are based on the most recent Mortgage that was taken out on this home.
Original Mortgage
$47,000
Interest Rate
6.11%
Mortgage Type
Purchase Money Mortgage
Purchase Details
Closed on
Nov 6, 2007
Sold by
Terry Cornelius E
Bought by
Wachovia Mortgage Corp
Create a Home Valuation Report for This Property
The Home Valuation Report is an in-depth analysis detailing your home's value as well as a comparison with similar homes in the area
Home Values in the Area
Average Home Value in this Area
Purchase History
| Date | Buyer | Sale Price | Title Company |
|---|---|---|---|
| Houston Maruska | $82,000 | None Available | |
| Stamm Robert | $41,000 | None Available | |
| Wachovia Mortgage Corp | $74,760 | None Available |
Source: Public Records
Mortgage History
| Date | Status | Borrower | Loan Amount |
|---|---|---|---|
| Open | Houston Maruska | $5,000 | |
| Open | Houston Maruska | $79,365 | |
| Previous Owner | Stamm Robert | $47,000 |
Source: Public Records
Tax History Compared to Growth
Tax History
| Year | Tax Paid | Tax Assessment Tax Assessment Total Assessment is a certain percentage of the fair market value that is determined by local assessors to be the total taxable value of land and additions on the property. | Land | Improvement |
|---|---|---|---|---|
| 2025 | $813 | $33,392 | $4,956 | $28,436 |
| 2024 | $812 | $33,448 | $3,656 | $29,792 |
| 2023 | $123 | $33,448 | $3,656 | $29,792 |
| 2022 | $847 | $26,976 | $3,656 | $23,320 |
| 2021 | $840 | $26,624 | $3,656 | $22,968 |
| 2020 | $840 | $26,624 | $3,656 | $22,968 |
| 2019 | $845 | $26,624 | $3,656 | $22,968 |
| 2018 | $845 | $26,624 | $3,656 | $22,968 |
| 2017 | $849 | $26,624 | $3,656 | $22,968 |
| 2016 | $853 | $33,961 | $3,498 | $30,463 |
| 2015 | $855 | $33,961 | $3,498 | $30,463 |
| 2014 | $857 | $33,961 | $3,498 | $30,463 |
| 2013 | -- | $33,961 | $3,498 | $30,463 |
Source: Public Records
Map
Nearby Homes
- 80 Lafayette Dr
- 76 Lafayette Dr
- 72 Lafayette Dr
- 21 Benning Dell Dr
- 102 Patton Dr
- 19 Benning Dell Dr
- 106 Patton Dr
- 23 Benning Dell Dr
- 68 Lafayette Dr
- 17 Benning Dell Dr
- 110 Patton Dr
- 91 Lafayette Dr
- 85 Lafayette Dr
- 64 Lafayette Dr
- 81 Lafayette Dr
- 114 Patton Dr
- 15 Benning Dell Dr
- 77 Lafayette Dr
- 74 Pelham Dr
- 96 Patton Dr