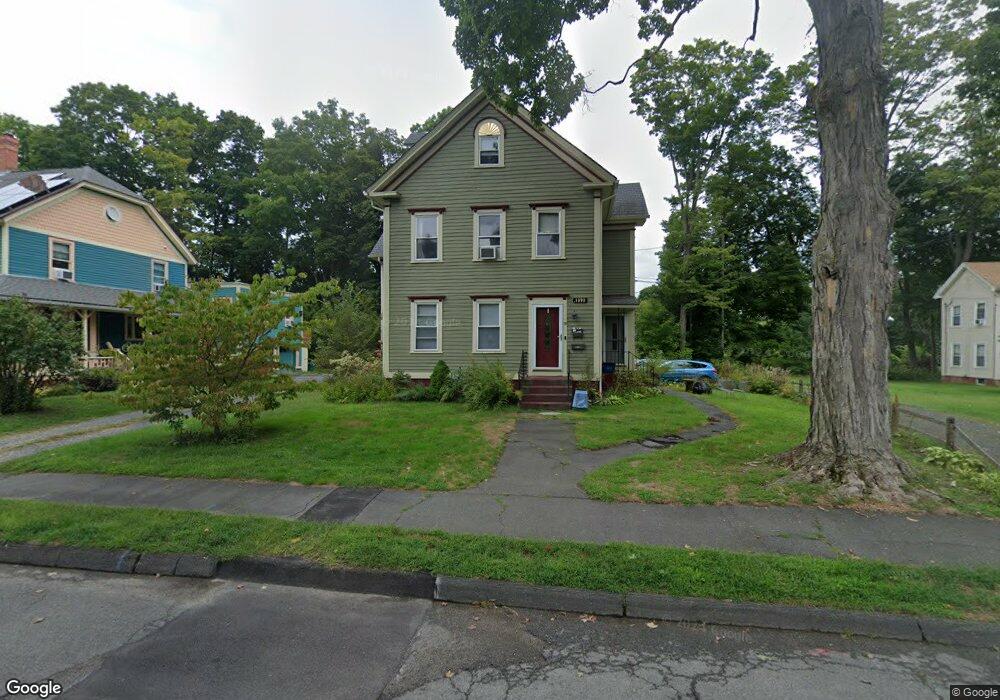
78 Lyman Rd Northampton, MA 01060
Estimated Value: $477,000 - $708,000
4
Beds
2
Baths
2,940
Sq Ft
$215/Sq Ft
Est. Value
About This Home
This home is located at 78 Lyman Rd, Northampton, MA 01060 and is currently estimated at $631,125, approximately $214 per square foot. 78 Lyman Rd is a home located in Hampshire County with nearby schools including Northampton High School, Hilltown Cooperative Charter Public School, and The Montessori School of Northampton.
Ownership History
Date
Name
Owned For
Owner Type
Purchase Details
Closed on
Sep 2, 2011
Sold by
Simmons Sara A
Bought by
Simmons Sara A and Simmons Chad G
Current Estimated Value
Home Financials for this Owner
Home Financials are based on the most recent Mortgage that was taken out on this home.
Original Mortgage
$257,000
Outstanding Balance
$175,612
Interest Rate
4.52%
Mortgage Type
Purchase Money Mortgage
Estimated Equity
$455,513
Purchase Details
Closed on
Apr 13, 2006
Sold by
Arnold Gary T
Bought by
Simmons Sara A
Home Financials for this Owner
Home Financials are based on the most recent Mortgage that was taken out on this home.
Original Mortgage
$250,000
Interest Rate
6.28%
Mortgage Type
Purchase Money Mortgage
Create a Home Valuation Report for This Property
The Home Valuation Report is an in-depth analysis detailing your home's value as well as a comparison with similar homes in the area
Home Values in the Area
Average Home Value in this Area
Purchase History
| Date | Buyer | Sale Price | Title Company |
|---|---|---|---|
| Simmons Sara A | -- | -- | |
| Simmons Sara A | $250,000 | -- |
Source: Public Records
Mortgage History
| Date | Status | Borrower | Loan Amount |
|---|---|---|---|
| Open | Simmons Sara A | $257,000 | |
| Previous Owner | Simmons Sara A | $250,000 |
Source: Public Records
Tax History
| Year | Tax Paid | Tax Assessment Tax Assessment Total Assessment is a certain percentage of the fair market value that is determined by local assessors to be the total taxable value of land and additions on the property. | Land | Improvement |
|---|---|---|---|---|
| 2025 | $7,411 | $532,000 | $244,600 | $287,400 |
| 2024 | $7,540 | $496,400 | $222,400 | $274,000 |
| 2023 | $7,868 | $496,700 | $202,200 | $294,500 |
| 2022 | $7,163 | $400,400 | $189,000 | $211,400 |
| 2021 | $7,242 | $416,900 | $180,000 | $236,900 |
| 2020 | $7,004 | $416,900 | $180,000 | $236,900 |
| 2019 | $6,950 | $400,100 | $180,000 | $220,100 |
| 2018 | $6,741 | $395,600 | $180,000 | $215,600 |
| 2017 | $6,603 | $395,600 | $180,000 | $215,600 |
| 2016 | $6,393 | $395,600 | $180,000 | $215,600 |
| 2015 | $6,044 | $382,500 | $160,000 | $222,500 |
| 2014 | $5,887 | $382,500 | $160,000 | $222,500 |
Source: Public Records
Map
Nearby Homes
- 57 Columbus Ave
- 12 School St
- 8 Hockanum Rd Unit 10
- 23 Randolph Place Unit 109
- 107 Williams St Unit 2c
- 107 Williams St
- 107 Williams St Unit 3c
- 107 Williams St Unit A1
- 107 Williams St Unit 2B
- 244 Main St
- 231 Main St Unit 3R
- 29 Pleasant St Unit 1
- 23 Eastern Ave
- 283 South St
- 43 Center St Unit K
- 18 Cedar St
- 10 Hawley St Unit 4C
- 10 Hawley St Unit 4D
- 10 Hawley St Unit 1C
- 10 Hawley St Unit 4B
Your Personal Tour Guide
Ask me questions while you tour the home.