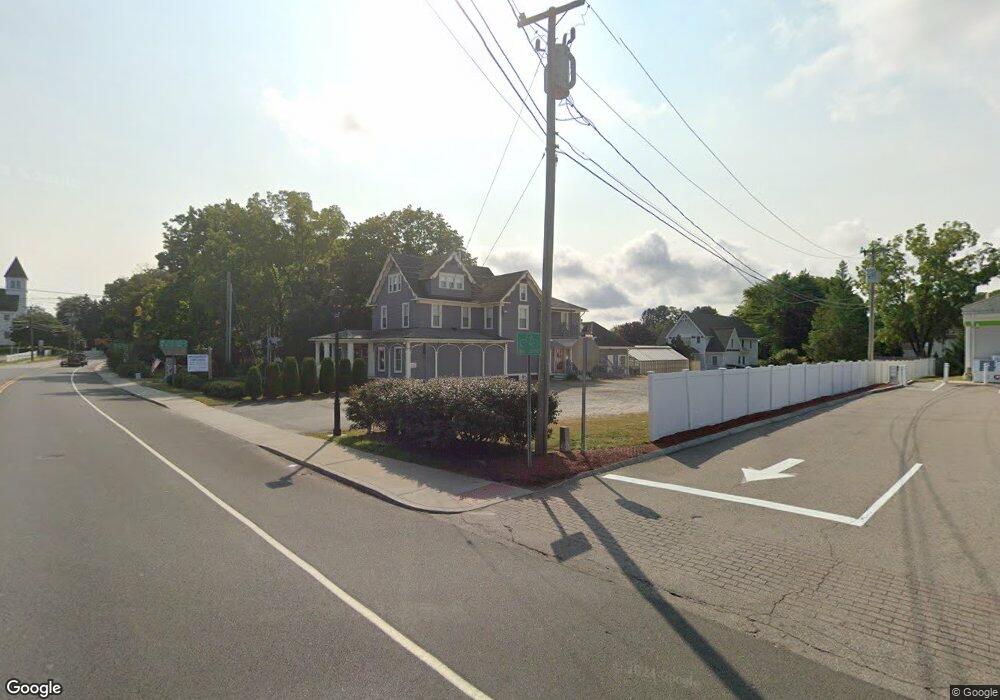
78 Main St Centerbrook, CT 06409
Estimated Value: $1,126,134
Studio
--
Bath
--
Sq Ft
98,446
Sq Ft Lot
About This Home
This home is located at 78 Main St, Centerbrook, CT 06409 and is currently estimated at $1,126,134. 78 Main St is a home located in Middlesex County with nearby schools including Valley Regional High School.
Ownership History
Date
Name
Owned For
Owner Type
Purchase Details
Closed on
May 9, 2003
Sold by
Wilkinson Steven L
Bought by
Rescon Rlty Llc
Current Estimated Value
Purchase Details
Closed on
Jan 28, 2000
Sold by
Knickerbocker Keith K
Bought by
Kelly Kevin P
Purchase Details
Closed on
Aug 8, 1991
Sold by
Ct Natl Bk
Bought by
Knickerbocker Keith K and Knickerbocker P
Create a Home Valuation Report for This Property
The Home Valuation Report is an in-depth analysis detailing your home's value as well as a comparison with similar homes in the area
Home Values in the Area
Average Home Value in this Area
Purchase History
| Date | Buyer | Sale Price | Title Company |
|---|---|---|---|
| Rescon Rlty Llc | $850,000 | -- | |
| Rescon Rlty Llc | $850,000 | -- | |
| Kelly Kevin P | $400,000 | -- | |
| Kelly Kevin P | $400,000 | -- | |
| Knickerbocker Keith K | $135,000 | -- |
Source: Public Records
Mortgage History
| Date | Status | Borrower | Loan Amount |
|---|---|---|---|
| Open | Knickerbocker Keith K | $650,000 | |
| Closed | Knickerbocker Keith K | $844,000 |
Source: Public Records
Tax History
| Year | Tax Paid | Tax Assessment Tax Assessment Total Assessment is a certain percentage of the fair market value that is determined by local assessors to be the total taxable value of land and additions on the property. | Land | Improvement |
|---|---|---|---|---|
| 2025 | $13,220 | $709,600 | $193,600 | $516,000 |
| 2024 | $12,808 | $709,600 | $193,600 | $516,000 |
| 2023 | $16,093 | $712,400 | $186,200 | $526,200 |
| 2022 | $16,136 | $712,400 | $186,200 | $526,200 |
| 2021 | $15,979 | $712,400 | $186,200 | $526,200 |
| 2020 | $15,537 | $712,400 | $186,200 | $526,200 |
| 2019 | $15,423 | $712,400 | $186,200 | $526,200 |
| 2018 | $15,811 | $723,600 | $186,200 | $537,400 |
| 2017 | $15,890 | $723,600 | $186,200 | $537,400 |
| 2016 | $15,617 | $723,700 | $186,200 | $537,500 |
| 2015 | $15,256 | $723,700 | $186,200 | $537,500 |
| 2014 | $15,190 | $723,700 | $186,200 | $537,500 |
Source: Public Records
Map
Nearby Homes
- 33 Deep River Rd
- 108 Westbrook Rd
- 1 Verona St
- 56 S Main St
- 29 Mitchel Terrace
- 130 Mares Hill Rd
- 16 N Main St
- 4 Bank Ln
- 11 N Main St
- 31 N Main St
- 45 Main St
- 89 Book Hill Rd
- 9 Essex Hills Dr
- 41B River Rd
- 85 River Rd Unit B7
- Lot 2 - 160 Saybrook Rd
- 22 Ebony Ln
- 134 Meadow Woods Rd
- 134 River Rd
- 120 Warsaw St
Your Personal Tour Guide
Ask me questions while you tour the home.