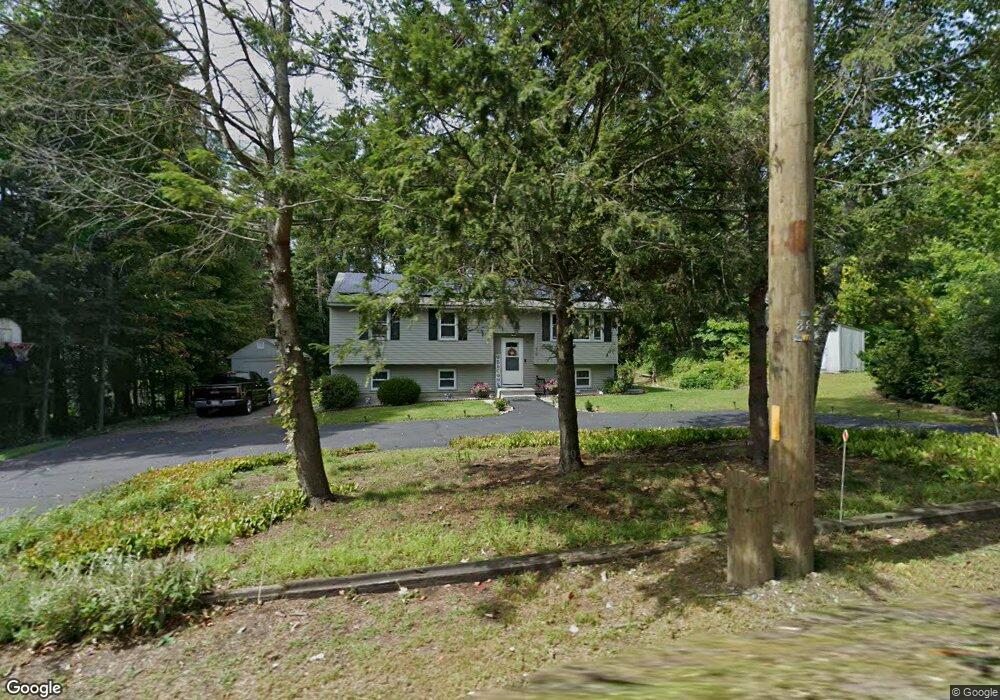
78 Nashua Rd Unit A Pepperell, MA 01463
Estimated Value: $435,000 - $604,000
3
Beds
1
Bath
1,584
Sq Ft
$341/Sq Ft
Est. Value
About This Home
This home is located at 78 Nashua Rd Unit A, Pepperell, MA 01463 and is currently estimated at $540,064, approximately $340 per square foot. 78 Nashua Rd Unit A is a home located in Middlesex County with nearby schools including North Middlesex Regional High School, Pepperell Christian Academy, and Maple Dene & Moppet School.
Ownership History
Date
Name
Owned For
Owner Type
Purchase Details
Closed on
Sep 24, 1992
Sold by
Winchester Sb
Bought by
Misch Steven J
Current Estimated Value
Home Financials for this Owner
Home Financials are based on the most recent Mortgage that was taken out on this home.
Original Mortgage
$64,000
Interest Rate
7.9%
Mortgage Type
Purchase Money Mortgage
Create a Home Valuation Report for This Property
The Home Valuation Report is an in-depth analysis detailing your home's value as well as a comparison with similar homes in the area
Home Values in the Area
Average Home Value in this Area
Purchase History
| Date | Buyer | Sale Price | Title Company |
|---|---|---|---|
| Misch Steven J | $114,000 | -- | |
| Misch Steven J | $114,000 | -- |
Source: Public Records
Mortgage History
| Date | Status | Borrower | Loan Amount |
|---|---|---|---|
| Closed | Misch Steven J | $64,000 |
Source: Public Records
Tax History
| Year | Tax Paid | Tax Assessment Tax Assessment Total Assessment is a certain percentage of the fair market value that is determined by local assessors to be the total taxable value of land and additions on the property. | Land | Improvement |
|---|---|---|---|---|
| 2025 | $6,714 | $458,900 | $194,700 | $264,200 |
| 2024 | $6,133 | $427,400 | $178,800 | $248,600 |
| 2023 | $5,950 | $393,000 | $152,200 | $240,800 |
| 2022 | $5,426 | $316,400 | $120,200 | $196,200 |
| 2021 | $5,310 | $296,300 | $105,000 | $191,300 |
| 2020 | $5,031 | $296,300 | $105,000 | $191,300 |
| 2019 | $4,551 | $274,300 | $105,000 | $169,300 |
| 2018 | $4,194 | $255,900 | $105,000 | $150,900 |
| 2017 | $3,882 | $244,300 | $97,400 | $146,900 |
| 2016 | $3,701 | $223,900 | $97,400 | $126,500 |
| 2015 | $3,571 | $223,900 | $97,400 | $126,500 |
| 2014 | $3,581 | $225,800 | $105,000 | $120,800 |
Source: Public Records
Map
Nearby Homes
- 8 Casie Ln
- 17 Merrimac Dr
- 27 Merrimac Dr
- 38 Tarbell St Unit 1D
- 28-30 Groton St
- 39 Hollis St Unit A
- 29 Tarbell St
- 72 Main St
- 14 Brookline St
- 11 Unkety Brook Way
- 12 Unkety Brook Way
- 58 Lowell Rd
- 24 Dow St
- 113-115 Main St
- 69 Main St Unit 71
- 114 Groton St
- 38 River Rd Unit 11
- 208 North St
- 77 Birchwood Dr
- 4 Southgate Rd
Your Personal Tour Guide
Ask me questions while you tour the home.