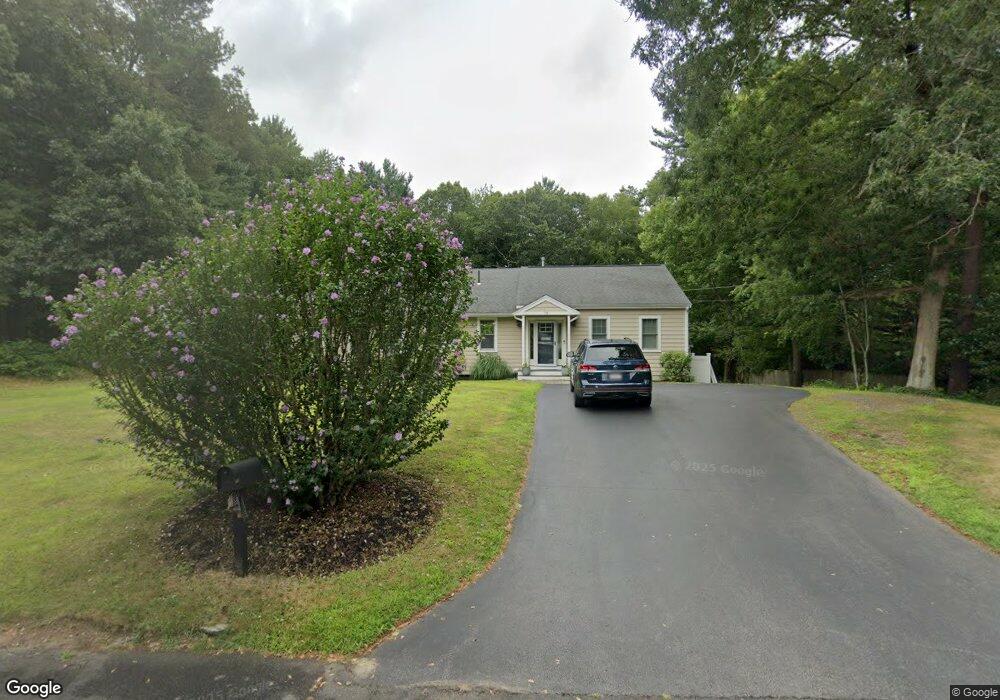
78 Old Farm Rd Hanover, MA 02339
Estimated Value: $689,192 - $835,000
3
Beds
2
Baths
1,758
Sq Ft
$419/Sq Ft
Est. Value
About This Home
This home is located at 78 Old Farm Rd, Hanover, MA 02339 and is currently estimated at $736,548, approximately $418 per square foot. 78 Old Farm Rd is a home located in Plymouth County with nearby schools including Hanover High School and The Master's Academy.
Ownership History
Date
Name
Owned For
Owner Type
Purchase Details
Closed on
Sep 21, 2021
Sold by
Honen Christopher and Smith-Honen Melissa
Bought by
Melissa Smith Honen Lt
Current Estimated Value
Purchase Details
Closed on
Nov 27, 2013
Sold by
Honen Melissa A
Bought by
Honen Melissa S and Honen Christopher
Home Financials for this Owner
Home Financials are based on the most recent Mortgage that was taken out on this home.
Original Mortgage
$272,712
Interest Rate
4.29%
Mortgage Type
New Conventional
Purchase Details
Closed on
Jul 1, 2010
Sold by
Honen John F and Honen Clare T
Bought by
Smith-Honen Melissa A
Home Financials for this Owner
Home Financials are based on the most recent Mortgage that was taken out on this home.
Original Mortgage
$261,248
Interest Rate
5.5%
Mortgage Type
FHA
Create a Home Valuation Report for This Property
The Home Valuation Report is an in-depth analysis detailing your home's value as well as a comparison with similar homes in the area
Home Values in the Area
Average Home Value in this Area
Purchase History
| Date | Buyer | Sale Price | Title Company |
|---|---|---|---|
| Melissa Smith Honen Lt | -- | None Available | |
| Honen Melissa S | -- | -- | |
| Smith-Honen Melissa A | $310,000 | -- |
Source: Public Records
Mortgage History
| Date | Status | Borrower | Loan Amount |
|---|---|---|---|
| Previous Owner | Honen Melissa S | $272,712 | |
| Previous Owner | Smith-Honen Melissa A | $261,248 |
Source: Public Records
Tax History Compared to Growth
Tax History
| Year | Tax Paid | Tax Assessment Tax Assessment Total Assessment is a certain percentage of the fair market value that is determined by local assessors to be the total taxable value of land and additions on the property. | Land | Improvement |
|---|---|---|---|---|
| 2025 | $7,345 | $594,700 | $269,400 | $325,300 |
| 2024 | $7,636 | $594,700 | $269,400 | $325,300 |
| 2023 | $7,862 | $582,800 | $244,900 | $337,900 |
| 2022 | $7,041 | $461,700 | $244,900 | $216,800 |
| 2021 | $7,319 | $448,200 | $222,600 | $225,600 |
| 2020 | $7,017 | $430,200 | $222,600 | $207,600 |
| 2019 | $6,705 | $408,600 | $222,600 | $186,000 |
| 2018 | $5,691 | $349,600 | $222,600 | $127,000 |
| 2017 | $5,749 | $348,000 | $209,500 | $138,500 |
| 2016 | $5,424 | $321,700 | $190,500 | $131,200 |
| 2015 | $5,195 | $321,700 | $190,500 | $131,200 |
Source: Public Records
Map
Nearby Homes