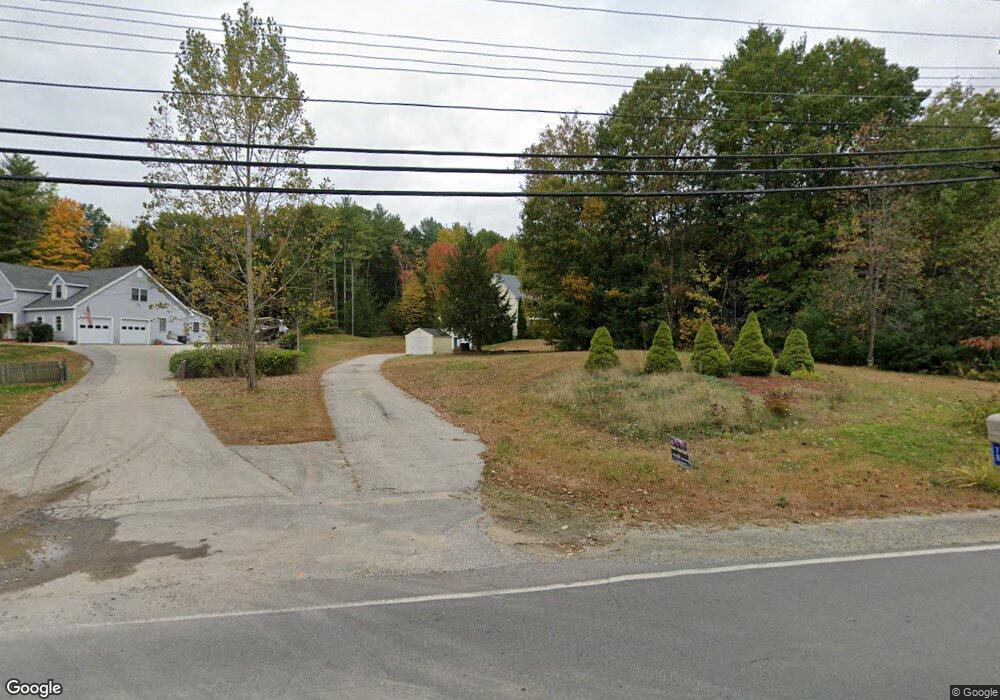
78 Peaselee Crossing Rd Newton, NH 03858
Estimated Value: $630,000 - $688,000
3
Beds
3
Baths
2,589
Sq Ft
$252/Sq Ft
Est. Value
About This Home
This home is located at 78 Peaselee Crossing Rd, Newton, NH 03858 and is currently estimated at $653,403, approximately $252 per square foot. 78 Peaselee Crossing Rd is a home located in Rockingham County with nearby schools including Memorial School, Sanborn Regional Middle School, and Sanborn Regional High School.
Ownership History
Date
Name
Owned For
Owner Type
Purchase Details
Closed on
Aug 25, 2023
Sold by
Griffin Paul E
Bought by
Helle Jeffrey D and Helle Kaela M
Current Estimated Value
Home Financials for this Owner
Home Financials are based on the most recent Mortgage that was taken out on this home.
Original Mortgage
$300,000
Outstanding Balance
$293,637
Interest Rate
6.96%
Mortgage Type
Purchase Money Mortgage
Estimated Equity
$359,766
Purchase Details
Closed on
Jun 8, 2017
Sold by
Griffni Paul E and Sanders Tammy A
Bought by
Griffin Paul E
Home Financials for this Owner
Home Financials are based on the most recent Mortgage that was taken out on this home.
Original Mortgage
$200,000
Interest Rate
4.03%
Mortgage Type
New Conventional
Purchase Details
Closed on
Jun 29, 2009
Sold by
Naimo David A and Naimo Charlene J
Bought by
Griffin Paul E and Sanders Tammy S
Purchase Details
Closed on
Jan 23, 2004
Sold by
Smith Christopher J and Smith Karen
Bought by
Naimo Charlene J and Naimo David A
Purchase Details
Closed on
Dec 15, 2000
Sold by
Bojack Custom Homes In
Bought by
Smith Christopher J and Smith Karen
Create a Home Valuation Report for This Property
The Home Valuation Report is an in-depth analysis detailing your home's value as well as a comparison with similar homes in the area
Home Values in the Area
Average Home Value in this Area
Purchase History
| Date | Buyer | Sale Price | Title Company |
|---|---|---|---|
| Helle Jeffrey D | $550,000 | None Available | |
| Griffin Paul E | $177,533 | -- | |
| Griffin Paul E | $314,900 | -- | |
| Naimo Charlene J | $326,000 | -- | |
| Smith Christopher J | $214,000 | -- |
Source: Public Records
Mortgage History
| Date | Status | Borrower | Loan Amount |
|---|---|---|---|
| Open | Helle Jeffrey D | $300,000 | |
| Previous Owner | Griffin Paul E | $200,000 | |
| Previous Owner | Smith Christopher J | $187,000 | |
| Previous Owner | Smith Christopher J | $190,500 | |
| Previous Owner | Smith Christopher J | $195,000 |
Source: Public Records
Tax History Compared to Growth
Tax History
| Year | Tax Paid | Tax Assessment Tax Assessment Total Assessment is a certain percentage of the fair market value that is determined by local assessors to be the total taxable value of land and additions on the property. | Land | Improvement |
|---|---|---|---|---|
| 2024 | $9,572 | $377,300 | $120,200 | $257,100 |
| 2023 | $9,285 | $377,300 | $120,200 | $257,100 |
| 2022 | $8,485 | $377,300 | $120,200 | $257,100 |
| 2021 | $7,886 | $377,300 | $120,200 | $257,100 |
| 2020 | $7,886 | $377,300 | $120,200 | $257,100 |
| 2019 | $8,138 | $308,500 | $85,200 | $223,300 |
| 2018 | $8,265 | $308,500 | $85,200 | $223,300 |
| 2017 | $8,200 | $308,500 | $85,200 | $223,300 |
| 2016 | $8,070 | $308,500 | $85,200 | $223,300 |
| 2015 | $8,073 | $308,500 | $85,200 | $223,300 |
| 2014 | $7,634 | $294,300 | $85,200 | $209,100 |
| 2013 | $7,446 | $294,300 | $85,200 | $209,100 |
Source: Public Records
Map
Nearby Homes
- 4 Quaker St
- 8 Chongor Dr
- 24 Crane Crossing Rd
- 25 Crane Crossing Rd
- 15 Bootland Farm Rd
- 2 Country Pond Rd
- 1 White Cedar Way Unit 1
- 7 Grebenstein Dr
- 56 Whittier St
- 9 Crane Crossing Rd Unit 6-1
- 3 Bent Grass Cir Unit 34
- 62 & 43 Wilders Grove Rd
- 21 W Shore Park Rd
- 5 Audrey Ln
- 18 Horizon Way
- 17 Horizon Way
- 6 Palmer Ave
- 55 Sweet Hill Rd
- 120 Newton Rd Unit 2D
- 1 Kinneret Dr
- 78 Peaslee Crossing
- 80 Peaselee Crossing Rd
- 76 Peaslee Crossing
- 76 Peaselee Crossing Rd
- 82 Peaslee Crossing Rd
- 75 Peaslee Crossing Rd
- 74 Peaselee Crossing Rd
- 72 Peaslee Crossing Rd
- 77 Peaselee Crossing Rd
- 72 Peaslee Crossing
- 2 Brenner Dr
- 71 Peaselee Crossing Rd
- 71 Peaslee Crossing Rd
- 73 Peaselee Crossing Rd
- 4 Brenner Dr
- 6 Brenner Dr
- 8 Brenner Dr
- 70 Peaselee Crossing Rd
- 68 Peaslee Crossing Rd
- 85 Peaslee Crossing