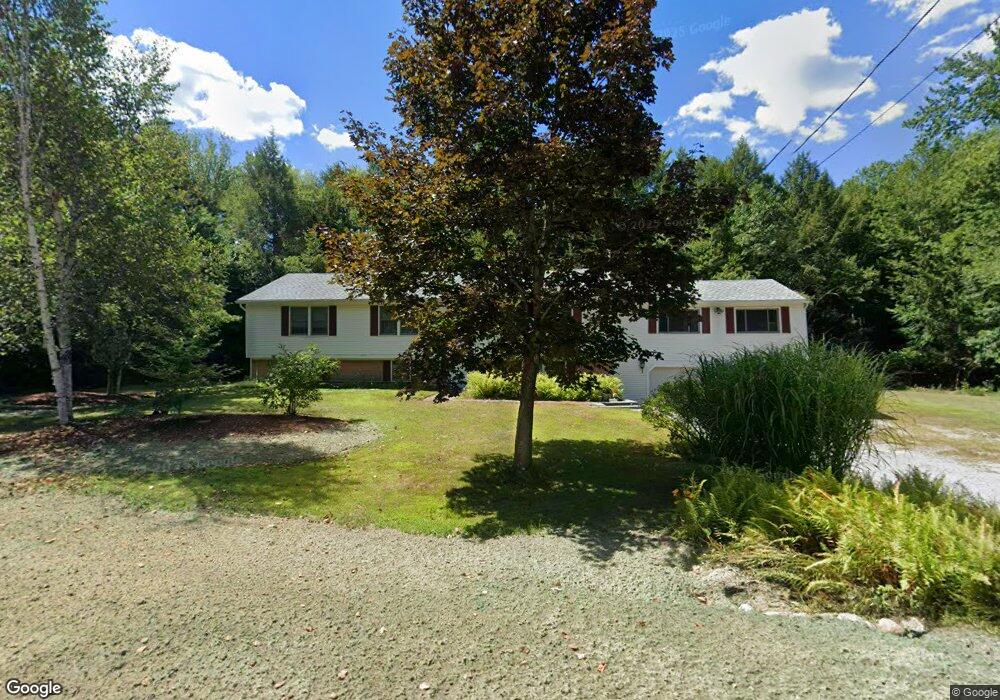
78 Picard Rd Peterborough, NH 03458
Estimated Value: $484,428 - $570,000
4
Beds
3
Baths
3,005
Sq Ft
$172/Sq Ft
Est. Value
About This Home
This home is located at 78 Picard Rd, Peterborough, NH 03458 and is currently estimated at $515,857, approximately $171 per square foot. 78 Picard Rd is a home located in Hillsborough County with nearby schools including Peterborough Elementary School, South Meadow School, and Conval Regional High School.
Ownership History
Date
Name
Owned For
Owner Type
Purchase Details
Closed on
Aug 30, 2018
Sold by
Griffin Kenneth
Bought by
Zett Lucinda M
Current Estimated Value
Purchase Details
Closed on
Aug 26, 2015
Sold by
Griffin Kenneth
Bought by
Griffin Kenneth and Griffin Lucinda M
Home Financials for this Owner
Home Financials are based on the most recent Mortgage that was taken out on this home.
Original Mortgage
$142,000
Interest Rate
4.09%
Mortgage Type
New Conventional
Purchase Details
Closed on
Aug 17, 1998
Sold by
Wheeler James D and Wheeler Nancy J
Bought by
Griffin Kenneth and Griffin Diana J
Home Financials for this Owner
Home Financials are based on the most recent Mortgage that was taken out on this home.
Original Mortgage
$144,000
Interest Rate
6.94%
Create a Home Valuation Report for This Property
The Home Valuation Report is an in-depth analysis detailing your home's value as well as a comparison with similar homes in the area
Home Values in the Area
Average Home Value in this Area
Purchase History
| Date | Buyer | Sale Price | Title Company |
|---|---|---|---|
| Zett Lucinda M | -- | -- | |
| Griffin Kenneth | -- | -- | |
| Griffin Kenneth | -- | -- | |
| Griffin Kenneth | $160,000 | -- |
Source: Public Records
Mortgage History
| Date | Status | Borrower | Loan Amount |
|---|---|---|---|
| Previous Owner | Griffin Kenneth | $142,000 | |
| Previous Owner | Griffin Kenneth | $165,000 | |
| Previous Owner | Griffin Kenneth | $144,000 |
Source: Public Records
Tax History Compared to Growth
Tax History
| Year | Tax Paid | Tax Assessment Tax Assessment Total Assessment is a certain percentage of the fair market value that is determined by local assessors to be the total taxable value of land and additions on the property. | Land | Improvement |
|---|---|---|---|---|
| 2024 | $10,150 | $312,300 | $84,500 | $227,800 |
| 2023 | $8,804 | $312,300 | $84,500 | $227,800 |
| 2022 | $8,076 | $312,300 | $84,500 | $227,800 |
| 2021 | $8,045 | $312,300 | $84,500 | $227,800 |
| 2020 | $7,217 | $234,000 | $51,600 | $182,400 |
| 2019 | $6,962 | $234,000 | $51,600 | $182,400 |
| 2018 | $7,041 | $234,000 | $51,600 | $182,400 |
| 2017 | $7,560 | $240,300 | $51,600 | $188,700 |
| 2016 | $7,328 | $237,600 | $51,600 | $186,000 |
| 2015 | $7,059 | $237,600 | $51,600 | $186,000 |
Source: Public Records
Map
Nearby Homes
- 77 Hancock Rd
- 18 Colonial Square
- 205 Southfield Ln
- 27 Trails Edge Commons
- 78 Old Greenfield Rd
- 42 Blueberry Ln
- 311 Old Street Rd
- 11 Woodmans Ln
- 13 Westridge Dr Unit 13
- 21 Eastridge Dr
- 18 W Ridge Dr
- 215 General Miller Rd
- 227 Union St
- 43 Lucy Ln
- 4 Cedar Ridge Dr
- 2 Lucy Ln
- 35 Lucy Ln
- 3 Lucy Ln
- 41 Lucy Ln
- 1 Lucy Ln