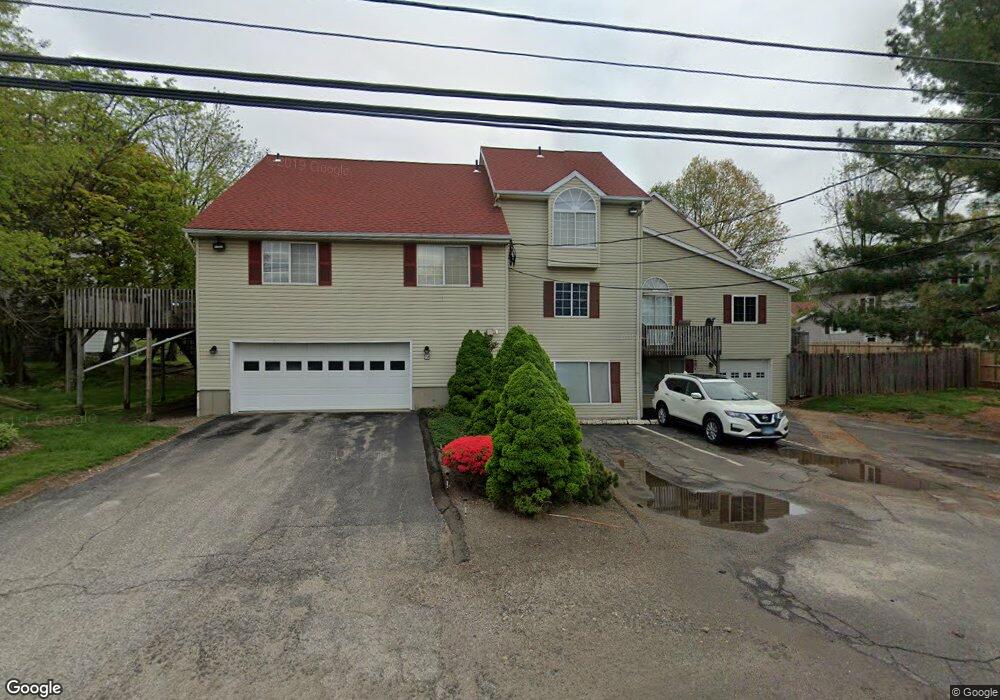
78 Pierpont Rd Unit 4 Waterbury, CT 06705
Out East NeighborhoodEstimated Value: $221,000 - $232,000
2
Beds
2
Baths
1,284
Sq Ft
$177/Sq Ft
Est. Value
About This Home
This home is located at 78 Pierpont Rd Unit 4, Waterbury, CT 06705 and is currently estimated at $226,732, approximately $176 per square foot. 78 Pierpont Rd Unit 4 is a home located in New Haven County with nearby schools including Margaret M. Generali Elementary School, Michael F. Wallace Middle School, and Crosby High School.
Ownership History
Date
Name
Owned For
Owner Type
Purchase Details
Closed on
Aug 15, 2014
Sold by
Ruiz Evelyn
Bought by
Wyatt Evelyn
Current Estimated Value
Home Financials for this Owner
Home Financials are based on the most recent Mortgage that was taken out on this home.
Original Mortgage
$96,800
Outstanding Balance
$73,755
Interest Rate
4.09%
Mortgage Type
New Conventional
Estimated Equity
$152,977
Purchase Details
Closed on
Apr 4, 2008
Sold by
Matriyenka Andrei and Matriyenka Zhanna
Bought by
Ruiz Evelyn
Home Financials for this Owner
Home Financials are based on the most recent Mortgage that was taken out on this home.
Original Mortgage
$137,700
Interest Rate
6.06%
Mortgage Type
Purchase Money Mortgage
Purchase Details
Closed on
Feb 2, 2005
Sold by
Carozza Joyce
Bought by
Matviyenka Andrei and Matviyenka Zhanna
Home Financials for this Owner
Home Financials are based on the most recent Mortgage that was taken out on this home.
Original Mortgage
$115,900
Interest Rate
5.77%
Mortgage Type
Purchase Money Mortgage
Purchase Details
Closed on
Oct 17, 2003
Sold by
Jannetty Kevin
Bought by
Carozza Joyce
Create a Home Valuation Report for This Property
The Home Valuation Report is an in-depth analysis detailing your home's value as well as a comparison with similar homes in the area
Home Values in the Area
Average Home Value in this Area
Purchase History
| Date | Buyer | Sale Price | Title Company |
|---|---|---|---|
| Wyatt Evelyn | $121,000 | -- | |
| Ruiz Evelyn | $153,000 | -- | |
| Matviyenka Andrei | $122,000 | -- | |
| Carozza Joyce | $96,500 | -- |
Source: Public Records
Mortgage History
| Date | Status | Borrower | Loan Amount |
|---|---|---|---|
| Open | Carozza Joyce | $96,800 | |
| Previous Owner | Carozza Joyce | $137,700 | |
| Previous Owner | Carozza Joyce | $20,445 | |
| Previous Owner | Carozza Joyce | $115,900 |
Source: Public Records
Tax History Compared to Growth
Tax History
| Year | Tax Paid | Tax Assessment Tax Assessment Total Assessment is a certain percentage of the fair market value that is determined by local assessors to be the total taxable value of land and additions on the property. | Land | Improvement |
|---|---|---|---|---|
| 2025 | $3,879 | $86,240 | $0 | $86,240 |
| 2024 | $4,264 | $86,240 | $0 | $86,240 |
| 2023 | $4,673 | $86,240 | $0 | $86,240 |
| 2022 | $3,938 | $65,410 | $0 | $65,410 |
| 2021 | $3,938 | $65,410 | $0 | $65,410 |
| 2020 | $3,938 | $65,410 | $0 | $65,410 |
| 2019 | $3,938 | $65,410 | $0 | $65,410 |
| 2018 | $3,938 | $65,410 | $0 | $65,410 |
| 2017 | $3,780 | $62,780 | $0 | $62,780 |
| 2016 | $3,780 | $62,780 | $0 | $62,780 |
| 2015 | $3,655 | $62,780 | $0 | $62,780 |
| 2014 | -- | $62,780 | $0 | $62,780 |
Source: Public Records
Map
Nearby Homes
- 3280 E Main St
- 3221 E Main St Unit B
- 38 Mapleridge Dr
- 68 Mapleridge Dr
- 135 Norris St
- 49 Birchfield Dr
- 23 Heaton St
- 2916 E Main St
- 61 Bentwood Dr Unit 5
- 110 Midland Rd
- 1190 Meriden Rd
- 519 Scott Rd Unit 60
- 1400 Meriden Rd Unit 6-5
- 0 Barker Terrace Unit 24105439
- 425 Scott Rd
- 975 Meriden Rd Unit 20
- 975 Meriden Rd Unit 109
- 975 Meriden Rd Unit 3
- 975 Meriden Rd Unit 29
- 541 Pierpont Rd Unit 2
- 78 Pierpont Rd Unit 9
- 78 Pierpont Rd Unit 8
- 78 Pierpont Rd Unit 7
- 78 Pierpont Rd Unit 6
- 78 Pierpont Rd Unit 3
- 78 Pierpont Rd Unit 2
- 78 Pierpont Rd Unit 1
- 78 Pierpont Rd Unit C-6
- 78 Pierpont Rd Unit 2C
- 78 Pierpont Rd Unit C-9
- 78 Pierpont Rd Unit c4
- 3366 E Main St
- 3356 E Main St
- 62 Pierpont Rd # 4
- 62 Pierpont Rd Unit D8
- 62 Pierpont Rd Unit 9
- 62 Pierpont Rd Unit 8
- 62 Pierpont Rd Unit 7
- 62 Pierpont Rd Unit 6
- 62 Pierpont Rd Unit 5