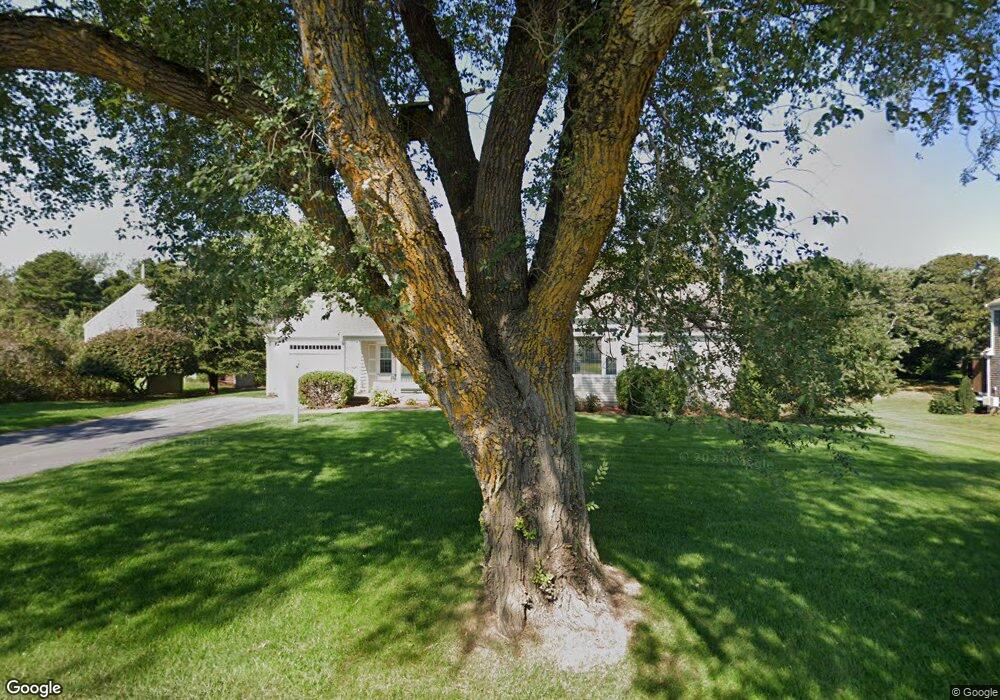
78 Pleasant St West Dennis, MA 02670
Dennis Port NeighborhoodEstimated Value: $631,000 - $781,000
3
Beds
2
Baths
1,507
Sq Ft
$458/Sq Ft
Est. Value
About This Home
This home is located at 78 Pleasant St, West Dennis, MA 02670 and is currently estimated at $690,863, approximately $458 per square foot. 78 Pleasant St is a home located in Barnstable County with nearby schools including Dennis-Yarmouth Regional High School and St. Pius X. School.
Ownership History
Date
Name
Owned For
Owner Type
Purchase Details
Closed on
May 15, 2024
Sold by
Silva Julie
Bought by
Julie Ann Silva Ret and Silva
Current Estimated Value
Purchase Details
Closed on
Dec 28, 2020
Sold by
Richardson Christopher G
Bought by
Silva Julie
Home Financials for this Owner
Home Financials are based on the most recent Mortgage that was taken out on this home.
Original Mortgage
$443,290
Interest Rate
2.8%
Mortgage Type
New Conventional
Purchase Details
Closed on
Oct 3, 2017
Sold by
Buckland Mary
Bought by
Richardson Christopher G
Home Financials for this Owner
Home Financials are based on the most recent Mortgage that was taken out on this home.
Original Mortgage
$267,120
Interest Rate
3.89%
Mortgage Type
New Conventional
Purchase Details
Closed on
Aug 26, 2016
Sold by
Wells Fargo Bank Na Tr
Bought by
Buckland Mary
Purchase Details
Closed on
Jun 13, 2005
Sold by
Galvin Robert D
Bought by
Stefani Raina
Home Financials for this Owner
Home Financials are based on the most recent Mortgage that was taken out on this home.
Original Mortgage
$192,000
Interest Rate
5.79%
Mortgage Type
Purchase Money Mortgage
Purchase Details
Closed on
Sep 30, 1998
Sold by
Moriarty James and Moriarty Lucinda L
Bought by
Galvin Robert D
Create a Home Valuation Report for This Property
The Home Valuation Report is an in-depth analysis detailing your home's value as well as a comparison with similar homes in the area
Home Values in the Area
Average Home Value in this Area
Purchase History
| Date | Buyer | Sale Price | Title Company |
|---|---|---|---|
| Julie Ann Silva Ret | -- | None Available | |
| Julie Ann Silva Ret | -- | None Available | |
| Silva Julie | $457,000 | None Available | |
| Richardson Christopher G | $333,900 | -- | |
| Buckland Mary | $180,500 | -- | |
| Stefani Raina | $240,000 | -- | |
| Galvin Robert D | $108,400 | -- | |
| Stefani Raina | $240,000 | -- | |
| Galvin Robert D | $108,400 | -- |
Source: Public Records
Mortgage History
| Date | Status | Borrower | Loan Amount |
|---|---|---|---|
| Previous Owner | Silva Julie | $443,290 | |
| Previous Owner | Richardson Christopher G | $267,120 | |
| Previous Owner | Stefani Raina | $192,000 | |
| Previous Owner | Stefani Raina | $48,000 |
Source: Public Records
Tax History Compared to Growth
Tax History
| Year | Tax Paid | Tax Assessment Tax Assessment Total Assessment is a certain percentage of the fair market value that is determined by local assessors to be the total taxable value of land and additions on the property. | Land | Improvement |
|---|---|---|---|---|
| 2025 | $2,703 | $624,300 | $186,600 | $437,700 |
| 2024 | $2,638 | $601,000 | $179,500 | $421,500 |
| 2023 | $2,552 | $546,500 | $163,200 | $383,300 |
| 2022 | $2,417 | $431,600 | $147,000 | $284,600 |
| 2021 | $1,851 | $306,900 | $144,100 | $162,800 |
| 2020 | $1,794 | $294,100 | $133,000 | $161,100 |
| 2019 | $1,826 | $296,000 | $130,400 | $165,600 |
| 2018 | $1,776 | $280,200 | $134,500 | $145,700 |
| 2017 | $1,748 | $284,200 | $123,800 | $160,400 |
| 2016 | $1,704 | $260,900 | $129,000 | $131,900 |
| 2015 | $1,670 | $260,900 | $129,000 | $131,900 |
| 2014 | $1,390 | $218,900 | $113,500 | $105,400 |
Source: Public Records
Map
Nearby Homes
- 159 Center St Unit 22
- 12 Cross St
- 73 Division St
- 221 Upper County Rd Unit 2A
- 221 Upper County Rd Unit 2A
- 26 Manning Rd
- 47 Telegraph Rd Unit 1
- 12 Candlewood Ln Unit 2-9
- 148 Belmont Rd
- 141 Division St
- 9 Country Ln
- 141 Division St
- 166 Upper County Rd Unit 1-4
- 40 Willow St
- 45 Route 28
- 79 Massachusetts 28
- 3 Fairbanks Dr
- 6 Bayberry Ln
- 11 Ocean Park W
- 78 Pleasant St
- 76 Pleasant St
- 76 Pleasant St Unit 2
- 76 Pleasant St Unit 1 & 2
- 76 Pleasant St
- 82 Pleasant St
- 74 Pleasant St Unit 2
- 74 Pleasant St Unit 3 & 4
- 74 Pleasant St
- 19 Rogers Way
- 73 Pleasant St
- 70 Pleasant St
- 172 Depot St
- 174 Depot St
- 15 Rogers Way
- 69 Pleasant St
- 166 Depot St
- 90 Pleasant St
- 160 Center St
- 11 Rogers Way