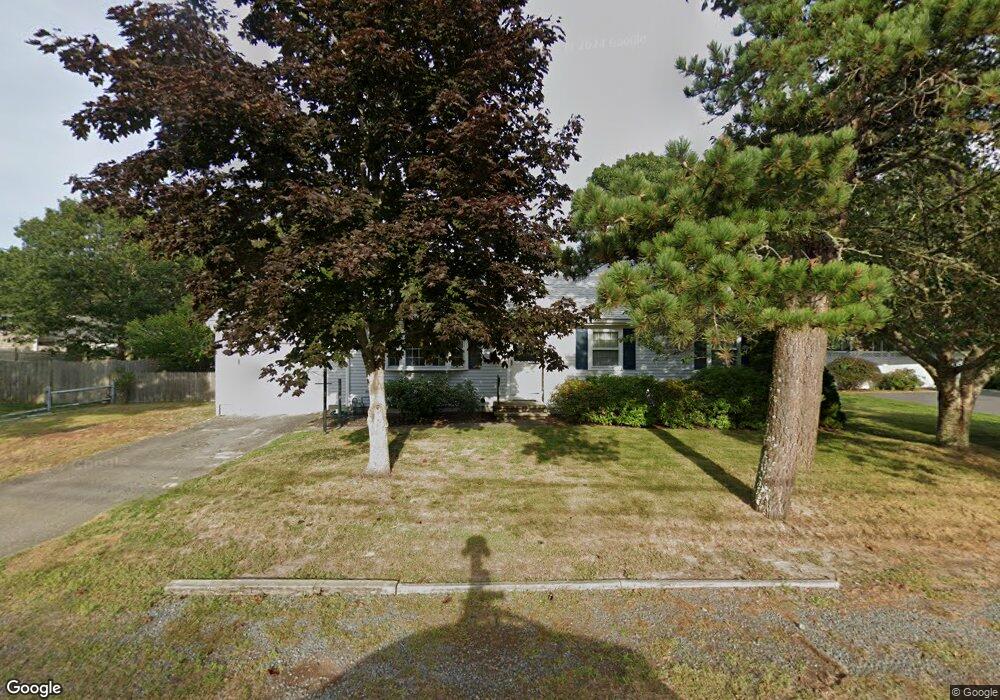
78 Raymond Ave South Yarmouth, MA 02664
Estimated Value: $620,900 - $641,000
3
Beds
2
Baths
1,192
Sq Ft
$528/Sq Ft
Est. Value
About This Home
This home is located at 78 Raymond Ave, South Yarmouth, MA 02664 and is currently estimated at $629,725, approximately $528 per square foot. 78 Raymond Ave is a home located in Barnstable County with nearby schools including Dennis-Yarmouth Regional High School and St. Pius X. School.
Ownership History
Date
Name
Owned For
Owner Type
Purchase Details
Closed on
May 28, 2009
Sold by
Martin Barbara J
Bought by
Barbara J Martin T and Martin Barbara J
Current Estimated Value
Home Financials for this Owner
Home Financials are based on the most recent Mortgage that was taken out on this home.
Original Mortgage
$100,000
Outstanding Balance
$63,994
Interest Rate
4.93%
Estimated Equity
$565,731
Purchase Details
Closed on
Nov 12, 1993
Sold by
Martin James F and Martin Joan M
Bought by
Martin Sylvester H and Martin Barbara J
Create a Home Valuation Report for This Property
The Home Valuation Report is an in-depth analysis detailing your home's value as well as a comparison with similar homes in the area
Home Values in the Area
Average Home Value in this Area
Purchase History
| Date | Buyer | Sale Price | Title Company |
|---|---|---|---|
| Barbara J Martin T | -- | -- | |
| Martin Sylvester H | $25,000 | -- |
Source: Public Records
Mortgage History
| Date | Status | Borrower | Loan Amount |
|---|---|---|---|
| Open | Martin Sylvester H | $100,000 | |
| Previous Owner | Martin Sylvester H | $50,000 | |
| Previous Owner | Martin Sylvester H | $30,000 |
Source: Public Records
Tax History Compared to Growth
Tax History
| Year | Tax Paid | Tax Assessment Tax Assessment Total Assessment is a certain percentage of the fair market value that is determined by local assessors to be the total taxable value of land and additions on the property. | Land | Improvement |
|---|---|---|---|---|
| 2025 | $3,936 | $555,900 | $155,300 | $400,600 |
| 2024 | $3,713 | $503,100 | $135,100 | $368,000 |
| 2023 | $3,768 | $464,600 | $116,900 | $347,700 |
| 2022 | $3,516 | $383,000 | $106,300 | $276,700 |
| 2021 | $3,257 | $340,700 | $106,300 | $234,400 |
| 2020 | $3,153 | $315,300 | $106,300 | $209,000 |
| 2019 | $2,877 | $284,900 | $106,300 | $178,600 |
| 2018 | $2,770 | $269,200 | $90,600 | $178,600 |
| 2017 | $2,657 | $265,200 | $86,600 | $178,600 |
| 2016 | $2,569 | $257,400 | $78,800 | $178,600 |
| 2015 | $2,428 | $241,800 | $78,800 | $163,000 |
Source: Public Records
Map
Nearby Homes