
Seller's Agent in 2025
Travis Cox
Compass Carolinas, LLC
(864) 800-9664
1 in this area
14 Total Sales
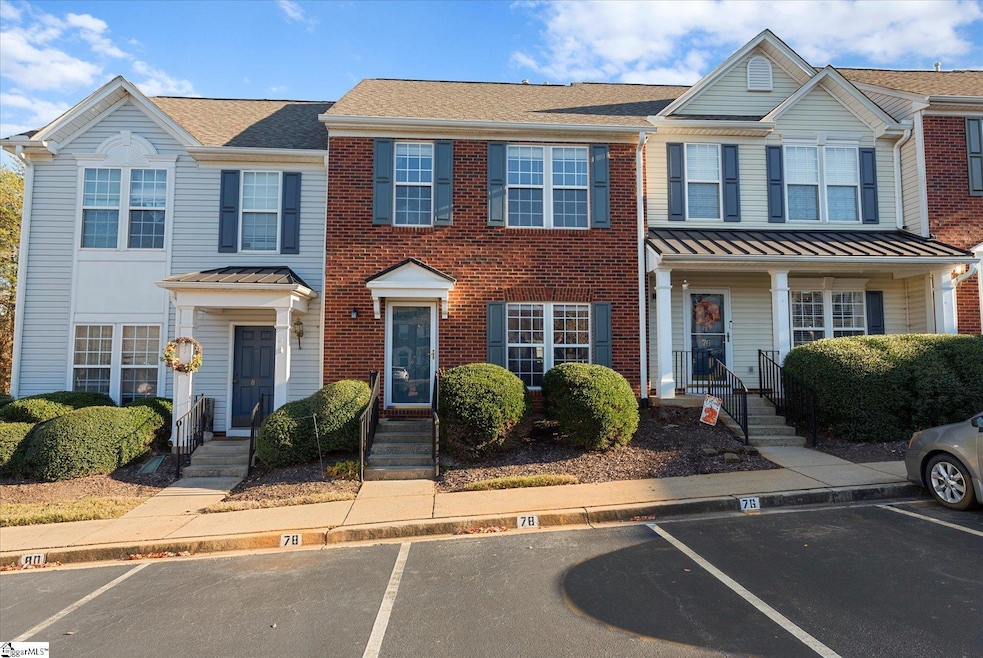
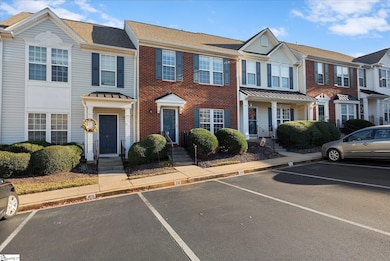
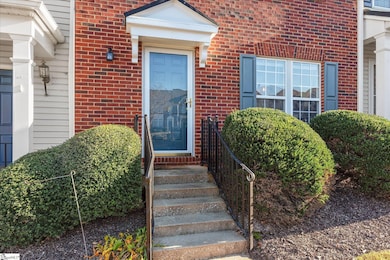
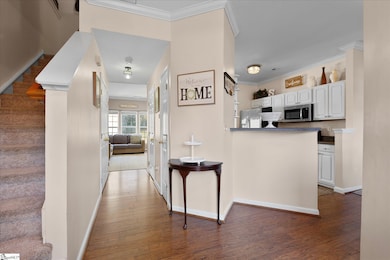
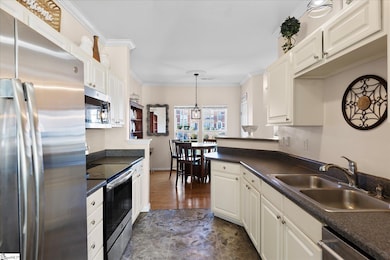
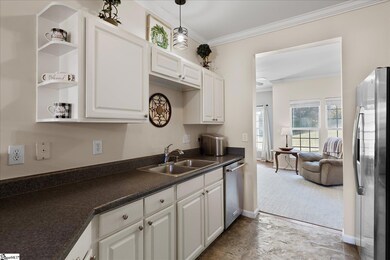
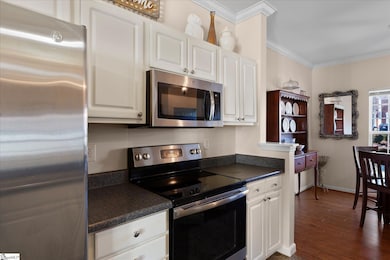
There’s no place like — 78 Spring Crossing Circle — a beautifully maintained 2-bedroom, 2.5-bath townhome offering comfort, convenience, and unbeatable location in one of Greer’s most sought-after communities. Inside, you’ll find an open and functional floor plan filled with natural light throughout. The kitchen features a pantry for added storage and flows seamlessly into the dining and living areas — perfect for entertaining or relaxing at home. Upstairs, both bedrooms are exceptionally spacious, offering plenty of room for larger furniture, home office setups, or simply extra breathing room — a rare find in this price point. Step outside to your private outdoor living space, ideal for morning coffee or evening gatherings, complete with a storage unit and no rear neighbors for added privacy. Located just steps from Riverside High School, this home puts you within minutes of everything you need — Lowe’s Foods, GSP Airport, Downtown Greer, shopping, dining, and everyday conveniences are all right around the corner. Residents of Spring Crossing enjoy access to a community pool, two assigned parking spaces, and plenty of additional guest parking. If you’ve been looking for a move-in-ready home in an unbeatable location with room to breathe — this is it.
Last Agent to Sell the Property
Compass Carolinas, LLC License #138161 Listed on: 11/13/2025
| Date | Type | Sale Price | Title Company |
|---|---|---|---|
| Deed | $103,000 | -- | |
| Deed | $105,500 | None Available | |
| Deed | $99,310 | -- | |
| Deed | $79,500 | -- |
| Date | Status | Loan Amount | Loan Type |
|---|---|---|---|
| Open | $97,850 | New Conventional | |
| Previous Owner | $103,870 | FHA |
| Date | Event | Price | List to Sale | Price per Sq Ft |
|---|---|---|---|---|
| 12/29/2025 12/29/25 | Sold | $215,000 | +2.4% | $154 / Sq Ft |
| 11/13/2025 11/13/25 | For Sale | $209,900 | -- | $150 / Sq Ft |
| Year | Tax Paid | Tax Assessment Tax Assessment Total Assessment is a certain percentage of the fair market value that is determined by local assessors to be the total taxable value of land and additions on the property. | Land | Improvement |
|---|---|---|---|---|
| 2025 | $1,081 | $4,780 | $1,040 | $3,740 |
| 2024 | $1,081 | $4,160 | $690 | $3,470 |
| 2023 | $996 | $4,160 | $690 | $3,470 |
| 2022 | $919 | $4,160 | $690 | $3,470 |
| 2021 | $914 | $4,160 | $690 | $3,470 |
| 2020 | $825 | $3,610 | $600 | $3,010 |
| 2019 | $826 | $3,610 | $600 | $3,010 |
| 2018 | $824 | $3,610 | $600 | $3,010 |
| 2017 | $821 | $3,610 | $600 | $3,010 |
| 2016 | $789 | $90,360 | $15,000 | $75,360 |
| 2015 | $864 | $90,360 | $15,000 | $75,360 |
| 2014 | $960 | $102,050 | $17,500 | $84,550 |
Seller's Agent in 2025
Travis Cox
Compass Carolinas, LLC
(864) 800-9664
1 in this area
14 Total Sales
Buyer's Agent in 2025
Chase Brehm
Keller Williams Greenville Central
(864) 432-8165
4 in this area
51 Total Sales
Source: Greater Greenville Association of REALTORS®
MLS Number: 1574740
APN: 0535.14-01-057.00
Disclaimer: Certain information contained herein is derived from information provided by parties other than Homes.com. All information provided is deemed reliable, but is not guaranteed to be accurate and should be independently verified.
![]() IDX information is provided exclusively for personal, non-commercial use, and may not be used for any purpose other than to identify prospective properties consumers may be interested in purchasing. Information is deemed reliable but not guaranteed.
IDX information is provided exclusively for personal, non-commercial use, and may not be used for any purpose other than to identify prospective properties consumers may be interested in purchasing. Information is deemed reliable but not guaranteed.
Ask me questions while you tour the home.