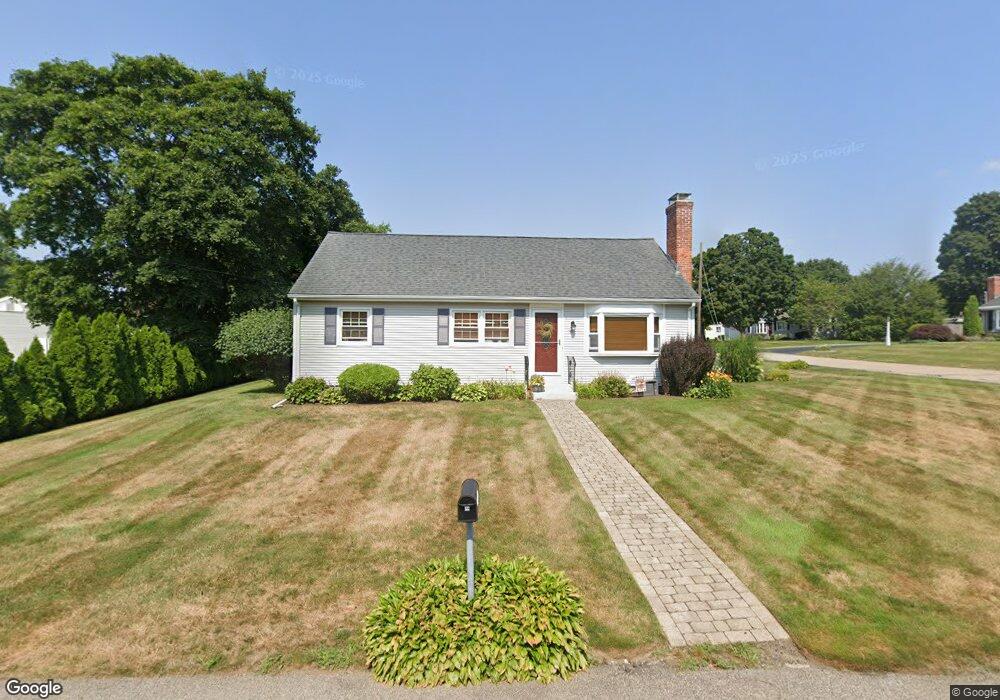
78 Watson St Seekonk, MA 02771
Monroes-South Seekonk NeighborhoodEstimated Value: $445,000 - $500,000
2
Beds
1
Bath
1,320
Sq Ft
$357/Sq Ft
Est. Value
About This Home
This home is located at 78 Watson St, Seekonk, MA 02771 and is currently estimated at $471,673, approximately $357 per square foot. 78 Watson St is a home located in Bristol County with nearby schools including Seekonk High School, St Mary Academy-Bay View, and Providence Country Day School.
Ownership History
Date
Name
Owned For
Owner Type
Purchase Details
Closed on
Jul 15, 1997
Sold by
Langwell John F and Langwell Anna L
Bought by
Marino Mark A and Marino Patricia
Current Estimated Value
Home Financials for this Owner
Home Financials are based on the most recent Mortgage that was taken out on this home.
Original Mortgage
$61,000
Outstanding Balance
$9,021
Interest Rate
7.86%
Mortgage Type
Purchase Money Mortgage
Estimated Equity
$462,652
Create a Home Valuation Report for This Property
The Home Valuation Report is an in-depth analysis detailing your home's value as well as a comparison with similar homes in the area
Home Values in the Area
Average Home Value in this Area
Purchase History
| Date | Buyer | Sale Price | Title Company |
|---|---|---|---|
| Marino Mark A | $101,000 | -- |
Source: Public Records
Mortgage History
| Date | Status | Borrower | Loan Amount |
|---|---|---|---|
| Open | Marino Mark A | $61,000 |
Source: Public Records
Tax History Compared to Growth
Tax History
| Year | Tax Paid | Tax Assessment Tax Assessment Total Assessment is a certain percentage of the fair market value that is determined by local assessors to be the total taxable value of land and additions on the property. | Land | Improvement |
|---|---|---|---|---|
| 2025 | $4,679 | $378,900 | $143,100 | $235,800 |
| 2024 | $4,502 | $364,500 | $143,100 | $221,400 |
| 2023 | $4,373 | $333,600 | $128,300 | $205,300 |
| 2022 | $3,979 | $298,300 | $122,700 | $175,600 |
| 2021 | $3,815 | $281,100 | $108,700 | $172,400 |
| 2020 | $3,573 | $271,300 | $108,800 | $162,500 |
| 2019 | $3,381 | $258,900 | $102,200 | $156,700 |
| 2018 | $3,099 | $232,100 | $99,400 | $132,700 |
| 2017 | $3,049 | $226,500 | $96,900 | $129,600 |
| 2016 | $3,020 | $225,200 | $96,900 | $128,300 |
| 2015 | $2,953 | $223,200 | $96,900 | $126,300 |
Source: Public Records
Map
Nearby Homes