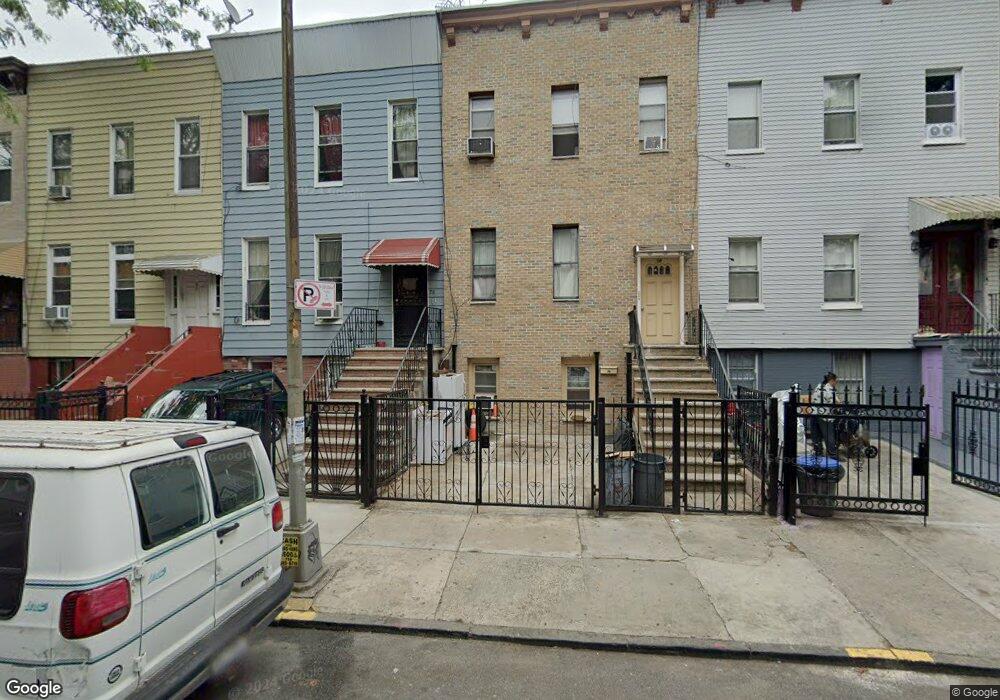
78 Weirfield St Brooklyn, NY 11221
Bushwick NeighborhoodEstimated Value: $1,012,935 - $1,651,000
Studio
--
Bath
3,000
Sq Ft
$456/Sq Ft
Est. Value
About This Home
This home is located at 78 Weirfield St, Brooklyn, NY 11221 and is currently estimated at $1,369,484, approximately $456 per square foot. 78 Weirfield St is a home located in Kings County with nearby schools including P.S./I.S. 045 Horace E. Greene, Evergreen Middle School for Urban Exploration, and Achievement First Bushwick Charter School.
Ownership History
Date
Name
Owned For
Owner Type
Purchase Details
Closed on
Mar 5, 2019
Sold by
Ross Anthony C and Ross Theresa
Bought by
Ross Timothy J
Current Estimated Value
Purchase Details
Closed on
Jun 15, 2000
Sold by
Faboo Inc
Bought by
Ross Anthony
Home Financials for this Owner
Home Financials are based on the most recent Mortgage that was taken out on this home.
Original Mortgage
$225,950
Interest Rate
8.1%
Mortgage Type
FHA
Purchase Details
Closed on
Mar 30, 2000
Sold by
Tucker Michael
Bought by
Faboo Inc
Home Financials for this Owner
Home Financials are based on the most recent Mortgage that was taken out on this home.
Original Mortgage
$98,000
Interest Rate
11.8%
Create a Home Valuation Report for This Property
The Home Valuation Report is an in-depth analysis detailing your home's value as well as a comparison with similar homes in the area
Home Values in the Area
Average Home Value in this Area
Purchase History
| Date | Buyer | Sale Price | Title Company |
|---|---|---|---|
| Ross Timothy J | -- | -- | |
| Ross Timothy J | -- | -- | |
| Ross Timothy J | -- | -- | |
| Ross Anthony | $228,000 | -- | |
| Ross Anthony | $228,000 | -- | |
| Ross Anthony C | -- | Fidelity National Title Ins | |
| Ross Anthony C | -- | Fidelity National Title Ins | |
| Faboo Inc | -- | -- | |
| Tucker Michael | $140,000 | -- | |
| Faboo Inc | -- | Chicago Title Insurance Co | |
| Faboo Inc | -- | Chicago Title Insurance Co | |
| Faboo Inc | -- | -- |
Source: Public Records
Mortgage History
| Date | Status | Borrower | Loan Amount |
|---|---|---|---|
| Previous Owner | Ross Anthony C | $225,950 | |
| Previous Owner | Faboo Inc | $98,000 | |
| Previous Owner | Faboo Inc | $0 |
Source: Public Records
Tax History
| Year | Tax Paid | Tax Assessment Tax Assessment Total Assessment is a certain percentage of the fair market value that is determined by local assessors to be the total taxable value of land and additions on the property. | Land | Improvement |
|---|---|---|---|---|
| 2025 | $3,108 | $62,520 | $11,940 | $50,580 |
| 2024 | $3,108 | $73,560 | $11,940 | $61,620 |
| 2023 | $2,969 | $90,240 | $11,940 | $78,300 |
| 2022 | $2,753 | $73,860 | $11,940 | $61,920 |
| 2021 | $2,744 | $81,000 | $11,940 | $69,060 |
| 2020 | $1,362 | $73,260 | $11,940 | $61,320 |
| 2019 | $3,122 | $62,460 | $11,940 | $50,520 |
| 2018 | $944 | $12,182 | $2,629 | $9,553 |
| 2017 | $872 | $11,493 | $2,377 | $9,116 |
| 2016 | $776 | $10,866 | $2,815 | $8,051 |
| 2015 | $434 | $10,846 | $3,164 | $7,682 |
| 2014 | $434 | $10,747 | $3,764 | $6,983 |
Source: Public Records
Map
Nearby Homes
- 1043 Halsey St Unit 1
- 89 Weirfield St
- 1288 Bushwick Ave
- 30 Weirfield St
- 1295 Bushwick Ave
- 110 Weirfield St
- 1019 Hancock St Unit 2B
- 1019 Hancock St Unit 1A
- 1019 Hancock St Unit 3B
- 1019 Hancock St Unit TWNHSE
- 1019 Hancock St Unit 4A
- 50 Eldert St
- 989 Halsey St Unit 1
- 990 Halsey St
- 1090 Hancock St
- 1079 Hancock St
- 1058 Jefferson Ave
- 26 Eldert St Unit 4
- 1044 Jefferson Ave
- 1044 Jefferson Ave Unit TWNHS
- 76 Weirfield St
- 80 Weirfield St
- 80 Weirfield St Unit 3
- 80 Weirfield St Unit 2
- 74 Weirfield St
- 82 Weirfield St
- 72 Weirfield St
- 84 Weirfield St
- 70 Weirfield St
- 70 Weirfield St Unit 1.4
- 70 Weirfield St Unit 1.2
- 70 Weirfield St Unit 3.4
- 70 Weirfield St Unit 3.3
- 86 Weirfield St
- 1047 Halsey St
- 1047 Halsey St Unit 1
- 88 Weirfield St
- 68 Weirfield St Unit 2
- 68 Weirfield St
- 1049 Halsey St
Your Personal Tour Guide
Ask me questions while you tour the home.