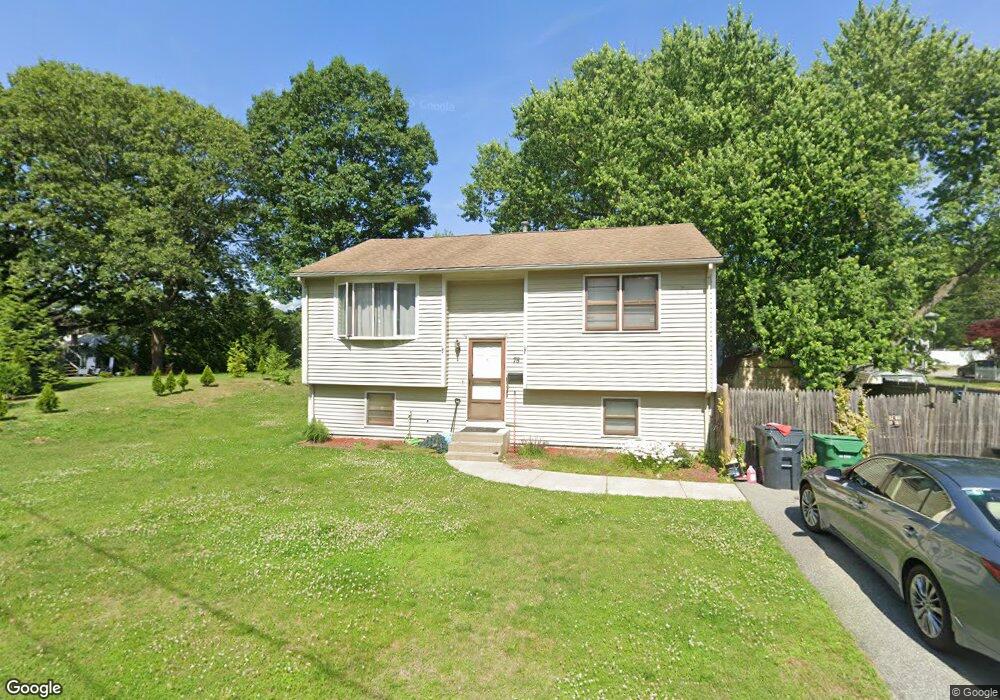
78 Wendell Rd Warwick, RI 02888
Lakewood NeighborhoodEstimated Value: $367,000 - $398,000
3
Beds
1
Bath
1,350
Sq Ft
$285/Sq Ft
Est. Value
About This Home
This home is located at 78 Wendell Rd, Warwick, RI 02888 and is currently estimated at $385,088, approximately $285 per square foot. 78 Wendell Rd is a home located in Kent County with nearby schools including Saint Paul School and St. Peter School.
Ownership History
Date
Name
Owned For
Owner Type
Purchase Details
Closed on
May 23, 2003
Sold by
Delmonico Michael and Delmonico Jenny
Bought by
Saucier Mark and Saucier Renee M
Current Estimated Value
Home Financials for this Owner
Home Financials are based on the most recent Mortgage that was taken out on this home.
Original Mortgage
$156,750
Outstanding Balance
$66,091
Interest Rate
5.86%
Mortgage Type
Purchase Money Mortgage
Estimated Equity
$318,997
Purchase Details
Closed on
Oct 30, 2001
Sold by
Gilbert Edwin P and Gilbert Tanya P
Bought by
Delmonico Michael and Delmonico Jenny
Home Financials for this Owner
Home Financials are based on the most recent Mortgage that was taken out on this home.
Original Mortgage
$125,000
Interest Rate
6.86%
Mortgage Type
Purchase Money Mortgage
Purchase Details
Closed on
Apr 1, 1993
Sold by
Smith Edward and Smith Victoria
Bought by
Gilbert Edwin P and Gilbert Tanya
Create a Home Valuation Report for This Property
The Home Valuation Report is an in-depth analysis detailing your home's value as well as a comparison with similar homes in the area
Home Values in the Area
Average Home Value in this Area
Purchase History
| Date | Buyer | Sale Price | Title Company |
|---|---|---|---|
| Saucier Mark | $165,000 | -- | |
| Delmonico Michael | $125,000 | -- | |
| Gilbert Edwin P | $90,000 | -- | |
| Gilbert Edwin P | $90,000 | -- |
Source: Public Records
Mortgage History
| Date | Status | Borrower | Loan Amount |
|---|---|---|---|
| Open | Gilbert Edwin P | $50,000 | |
| Closed | Gilbert Edwin P | $14,000 | |
| Open | Gilbert Edwin P | $156,750 | |
| Previous Owner | Gilbert Edwin P | $125,000 |
Source: Public Records
Tax History
| Year | Tax Paid | Tax Assessment Tax Assessment Total Assessment is a certain percentage of the fair market value that is determined by local assessors to be the total taxable value of land and additions on the property. | Land | Improvement |
|---|---|---|---|---|
| 2025 | $4,220 | $332,300 | $101,600 | $230,700 |
| 2024 | $3,971 | $274,400 | $83,900 | $190,500 |
| 2023 | $3,894 | $274,400 | $83,900 | $190,500 |
| 2022 | $3,669 | $195,900 | $51,700 | $144,200 |
| 2021 | $3,669 | $195,900 | $51,700 | $144,200 |
| 2020 | $3,669 | $195,900 | $51,700 | $144,200 |
| 2019 | $3,669 | $195,900 | $51,700 | $144,200 |
| 2018 | $3,390 | $163,000 | $51,700 | $111,300 |
| 2017 | $3,299 | $163,000 | $51,700 | $111,300 |
| 2016 | $3,299 | $163,000 | $51,700 | $111,300 |
| 2015 | $3,233 | $155,800 | $56,400 | $99,400 |
| 2014 | $3,125 | $155,800 | $56,400 | $99,400 |
| 2013 | $3,083 | $155,800 | $56,400 | $99,400 |
Source: Public Records
Map
Nearby Homes
- 84 Wendell Rd
- 113 Tennyson Rd
- 66 Wendell Rd
- 77 Wendell Rd
- 121 Tennyson Rd
- 87 Wendell Rd
- 67 Wendell Rd
- 94 Wendell Rd
- 170 Dryden Blvd
- 0 Wendell Rd
- 95 Wendell Rd
- 97 Tennyson Rd
- 110 Tennyson Rd
- 116 Tennyson Rd
- 57 Wendell Rd
- 122 Tennyson Rd
- 104 Tennyson Rd
- 133 Tennyson Rd
- 102 Wendell Rd
- 224 Northampton St
Your Personal Tour Guide
Ask me questions while you tour the home.