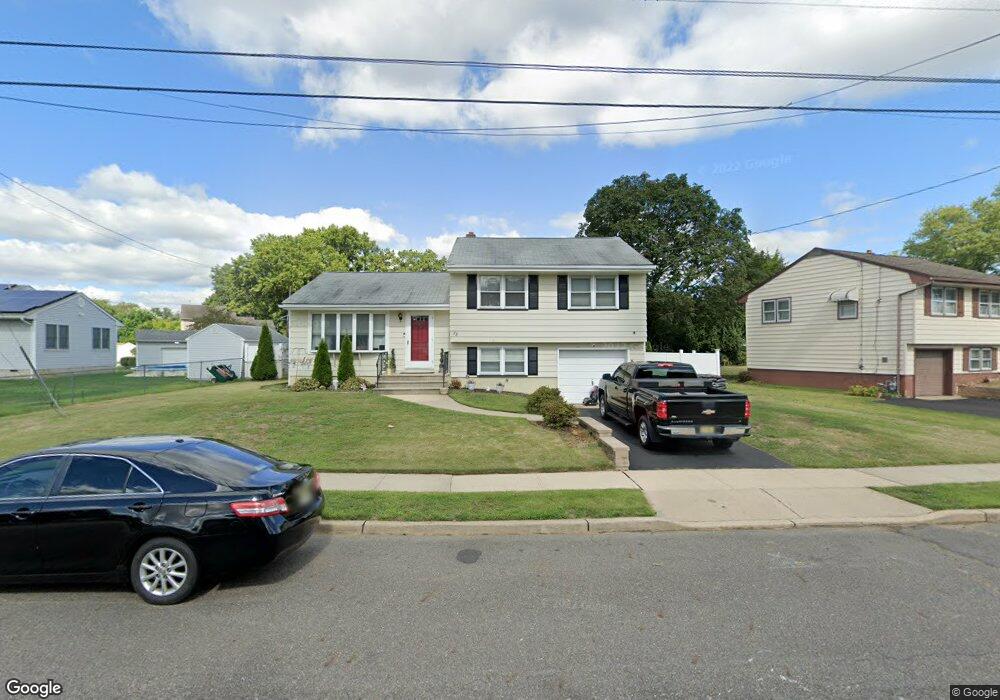
78 Winding Way Trenton, NJ 08620
Estimated Value: $438,078 - $484,000
--
Bed
--
Bath
1,580
Sq Ft
$297/Sq Ft
Est. Value
About This Home
This home is located at 78 Winding Way, Trenton, NJ 08620 and is currently estimated at $470,020, approximately $297 per square foot. 78 Winding Way is a home located in Mercer County with nearby schools including Yardville Heights Elementary School, Albert E. Grice Middle School, and Hamilton West-Watson High School.
Ownership History
Date
Name
Owned For
Owner Type
Purchase Details
Closed on
May 27, 2020
Sold by
Barton Kimberly and Riley Kimberly
Bought by
Brescio Kimberly and Brescio Michael J
Current Estimated Value
Home Financials for this Owner
Home Financials are based on the most recent Mortgage that was taken out on this home.
Original Mortgage
$222,709
Outstanding Balance
$156,563
Interest Rate
3.2%
Mortgage Type
New Conventional
Estimated Equity
$313,457
Purchase Details
Closed on
Feb 27, 2008
Purchase Details
Closed on
Nov 30, 2000
Sold by
Beveridge Alvin
Bought by
Riley Brian and Riley Kimberly
Home Financials for this Owner
Home Financials are based on the most recent Mortgage that was taken out on this home.
Original Mortgage
$153,900
Interest Rate
7.64%
Mortgage Type
Purchase Money Mortgage
Create a Home Valuation Report for This Property
The Home Valuation Report is an in-depth analysis detailing your home's value as well as a comparison with similar homes in the area
Home Values in the Area
Average Home Value in this Area
Purchase History
| Date | Buyer | Sale Price | Title Company |
|---|---|---|---|
| Brescio Kimberly | -- | None Available | |
| -- | -- | -- | |
| Riley Brian | $162,000 | -- |
Source: Public Records
Mortgage History
| Date | Status | Borrower | Loan Amount |
|---|---|---|---|
| Open | Brescio Kimberly | $222,709 | |
| Previous Owner | Riley Brian | $153,900 |
Source: Public Records
Tax History Compared to Growth
Tax History
| Year | Tax Paid | Tax Assessment Tax Assessment Total Assessment is a certain percentage of the fair market value that is determined by local assessors to be the total taxable value of land and additions on the property. | Land | Improvement |
|---|---|---|---|---|
| 2025 | $7,651 | $217,100 | $78,800 | $138,300 |
| 2024 | $7,171 | $217,100 | $78,800 | $138,300 |
| 2023 | $7,171 | $217,100 | $78,800 | $138,300 |
| 2022 | $7,058 | $217,100 | $78,800 | $138,300 |
| 2021 | $7,583 | $217,100 | $78,800 | $138,300 |
| 2020 | $6,802 | $217,100 | $78,800 | $138,300 |
| 2019 | $6,654 | $217,100 | $78,800 | $138,300 |
| 2018 | $6,596 | $217,100 | $78,800 | $138,300 |
| 2017 | $6,431 | $217,100 | $78,800 | $138,300 |
| 2016 | $5,870 | $217,100 | $78,800 | $138,300 |
| 2015 | $6,346 | $136,800 | $54,100 | $82,700 |
| 2014 | $6,239 | $136,800 | $54,100 | $82,700 |
Source: Public Records
Map
Nearby Homes