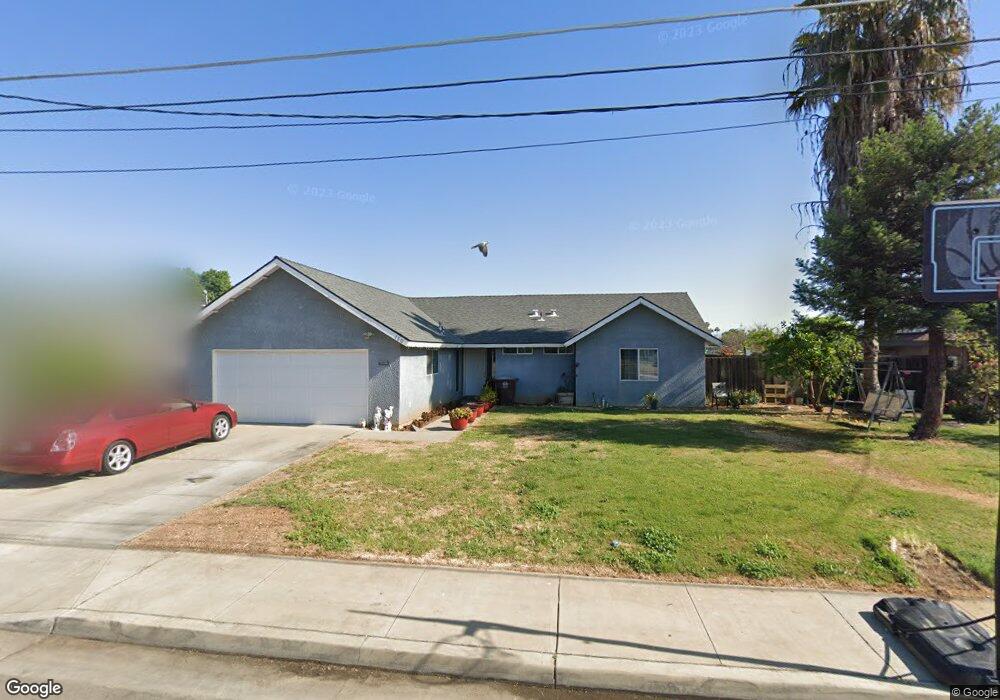
780 Edgar Ave Sanger, CA 93657
Estimated Value: $311,841 - $339,000
3
Beds
2
Baths
1,316
Sq Ft
$250/Sq Ft
Est. Value
About This Home
This home is located at 780 Edgar Ave, Sanger, CA 93657 and is currently estimated at $329,614, approximately $250 per square foot. 780 Edgar Ave is a home located in Fresno County with nearby schools including Jefferson Elementary School, Washington Academic Middle School, and Sanger High School.
Ownership History
Date
Name
Owned For
Owner Type
Purchase Details
Closed on
Aug 12, 2011
Sold by
California Housing Finance Agency
Bought by
Ceballos Martin B and Ceballos Araceli G
Current Estimated Value
Home Financials for this Owner
Home Financials are based on the most recent Mortgage that was taken out on this home.
Original Mortgage
$82,400
Outstanding Balance
$56,946
Interest Rate
4.53%
Mortgage Type
New Conventional
Estimated Equity
$272,668
Purchase Details
Closed on
Dec 2, 2010
Sold by
Reyna Michael A and Reyna Samantha
Bought by
California Housing Finance Agency
Purchase Details
Closed on
Aug 24, 2005
Sold by
Mckenney James W and Mckenney Tammy M
Bought by
Reyna Michael A and Reyna Samantha
Home Financials for this Owner
Home Financials are based on the most recent Mortgage that was taken out on this home.
Original Mortgage
$225,000
Interest Rate
5.72%
Mortgage Type
New Conventional
Create a Home Valuation Report for This Property
The Home Valuation Report is an in-depth analysis detailing your home's value as well as a comparison with similar homes in the area
Home Values in the Area
Average Home Value in this Area
Purchase History
| Date | Buyer | Sale Price | Title Company |
|---|---|---|---|
| Ceballos Martin B | $103,000 | First American Title Company | |
| California Housing Finance Agency | $239,432 | Lawyers Title | |
| Reyna Michael A | $225,000 | North American Title Co Inc |
Source: Public Records
Mortgage History
| Date | Status | Borrower | Loan Amount |
|---|---|---|---|
| Open | Ceballos Martin B | $82,400 | |
| Previous Owner | Reyna Michael A | $225,000 |
Source: Public Records
Tax History
| Year | Tax Paid | Tax Assessment Tax Assessment Total Assessment is a certain percentage of the fair market value that is determined by local assessors to be the total taxable value of land and additions on the property. | Land | Improvement |
|---|---|---|---|---|
| 2025 | $1,627 | $129,363 | $37,676 | $91,687 |
| 2023 | $1,523 | $124,342 | $36,214 | $88,128 |
| 2022 | $1,500 | $121,904 | $35,504 | $86,400 |
| 2021 | $1,487 | $119,514 | $34,808 | $84,706 |
| 2020 | $1,443 | $118,290 | $34,452 | $83,838 |
| 2019 | $1,414 | $115,972 | $33,777 | $82,195 |
| 2018 | $1,355 | $113,699 | $33,115 | $80,584 |
| 2017 | $1,331 | $111,470 | $32,466 | $79,004 |
| 2016 | $1,250 | $109,285 | $31,830 | $77,455 |
| 2015 | $1,261 | $107,644 | $31,352 | $76,292 |
| 2014 | $1,243 | $105,536 | $30,738 | $74,798 |
Source: Public Records
Map
Nearby Homes
Your Personal Tour Guide
Ask me questions while you tour the home.