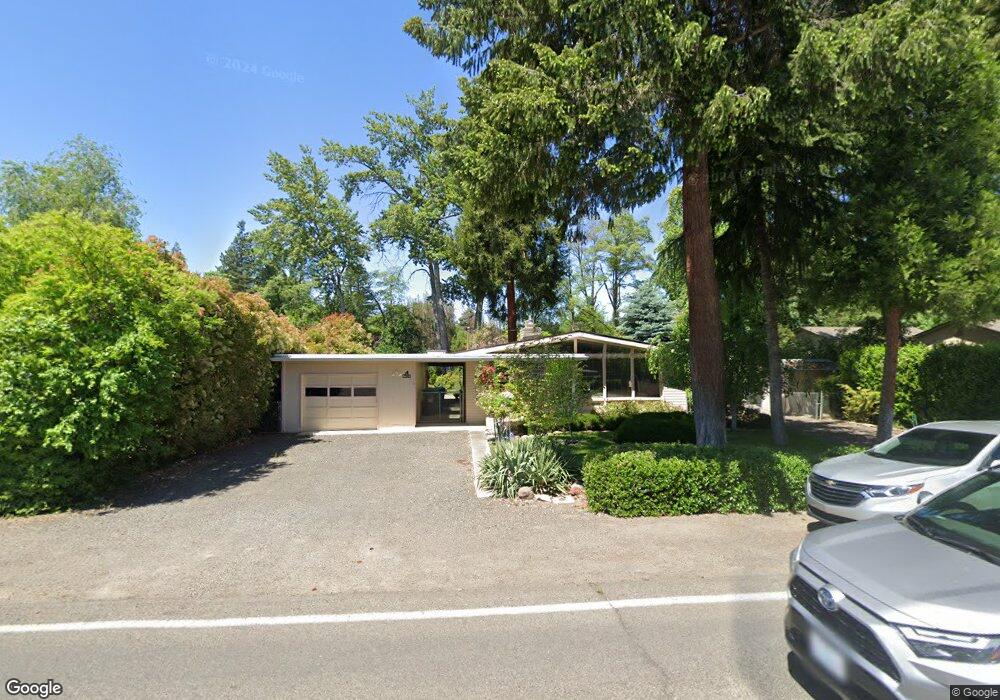
780 S Shasta Ave Eagle Point, OR 97524
Estimated Value: $296,000 - $335,110
3
Beds
1
Bath
1,247
Sq Ft
$251/Sq Ft
Est. Value
About This Home
This home is located at 780 S Shasta Ave, Eagle Point, OR 97524 and is currently estimated at $313,028, approximately $251 per square foot. 780 S Shasta Ave is a home located in Jackson County with nearby schools including Eagle Point Middle School, White Mountain Middle School, and Eagle Point High School.
Ownership History
Date
Name
Owned For
Owner Type
Purchase Details
Closed on
May 9, 2002
Sold by
Wendt Steven M
Bought by
Welsch Eugene J and Welsch Caroline R
Current Estimated Value
Home Financials for this Owner
Home Financials are based on the most recent Mortgage that was taken out on this home.
Original Mortgage
$134,000
Interest Rate
7.13%
Purchase Details
Closed on
Feb 23, 1998
Sold by
Butler John E and Butler Judy W
Bought by
Wendt Frederick L and Wendt Eleanore C
Home Financials for this Owner
Home Financials are based on the most recent Mortgage that was taken out on this home.
Original Mortgage
$79,650
Interest Rate
6.9%
Create a Home Valuation Report for This Property
The Home Valuation Report is an in-depth analysis detailing your home's value as well as a comparison with similar homes in the area
Home Values in the Area
Average Home Value in this Area
Purchase History
| Date | Buyer | Sale Price | Title Company |
|---|---|---|---|
| Welsch Eugene J | $126,900 | Jackson County Title | |
| Wendt Steven M | -- | Jackson County Title | |
| Wendt Frederick L | $88,500 | Jackson County Title |
Source: Public Records
Mortgage History
| Date | Status | Borrower | Loan Amount |
|---|---|---|---|
| Closed | Welsch Eugene J | $134,000 | |
| Previous Owner | Wendt Frederick L | $79,650 |
Source: Public Records
Tax History
| Year | Tax Paid | Tax Assessment Tax Assessment Total Assessment is a certain percentage of the fair market value that is determined by local assessors to be the total taxable value of land and additions on the property. | Land | Improvement |
|---|---|---|---|---|
| 2026 | $1,621 | $146,230 | -- | -- |
| 2025 | $1,583 | $141,980 | $52,720 | $89,260 |
| 2024 | $1,583 | $137,850 | $51,180 | $86,670 |
| 2023 | $1,529 | $133,840 | $49,690 | $84,150 |
| 2022 | $1,488 | $133,840 | $49,690 | $84,150 |
| 2021 | $1,444 | $129,950 | $48,250 | $81,700 |
| 2020 | $1,534 | $126,170 | $46,850 | $79,320 |
| 2019 | $1,510 | $118,940 | $44,170 | $74,770 |
| 2018 | $1,482 | $115,480 | $42,890 | $72,590 |
| 2017 | $1,445 | $115,480 | $42,890 | $72,590 |
| 2016 | $1,417 | $108,860 | $40,430 | $68,430 |
| 2015 | $1,371 | $108,860 | $40,430 | $68,430 |
| 2014 | $1,332 | $102,620 | $38,110 | $64,510 |
Source: Public Records
Map
Nearby Homes
- 0 Sf Little Butte Unit 220204792
- 133 Edith Cir
- 620 S Royal Ave
- 0 Crater Lake Hwy
- 650 Sarah Ln
- 10569 Hannon Rd
- 1065 S Shasta Ave
- 522 Meadow Ln
- 318 S Buchanan Ave
- 1288 S Shasta Ave
- 888 Arrowhead Trail
- 1314 S Shasta Ave Unit A
- 839 St Andrews Way
- 91 Morning Dove Trail
- 959 Pumpkin Ridge Dr
- 181 Morning Dove Trail
- 131 Bellerive Dr
- 869 St Andrews Way
- 964 Pumpkin Ridge
- 179 Skyhawk Dr
- 790 S Shasta Ave
- 772 S Shasta Ave
- 800 S Shasta Ave
- 746 S Shasta Ave
- 825 S Royal Ave
- 758 S Shasta Ave
- 779 S Shasta Ave
- 787 S Shasta Ave
- 771 S Shasta Ave
- 837 S Royal Ave
- 809 S Royal Ave
- 815 S Royal Ave
- 804 S Shasta Ave Unit 804\806
- 765 S Shasta Ave
- 740 S Shasta Ave
- 791 S Shasta Ave
- 808 S Shasta Ave
- 847 S Royal Ave
- 757 S Shasta Ave
- 803 S Royal Ave
Your Personal Tour Guide
Ask me questions while you tour the home.