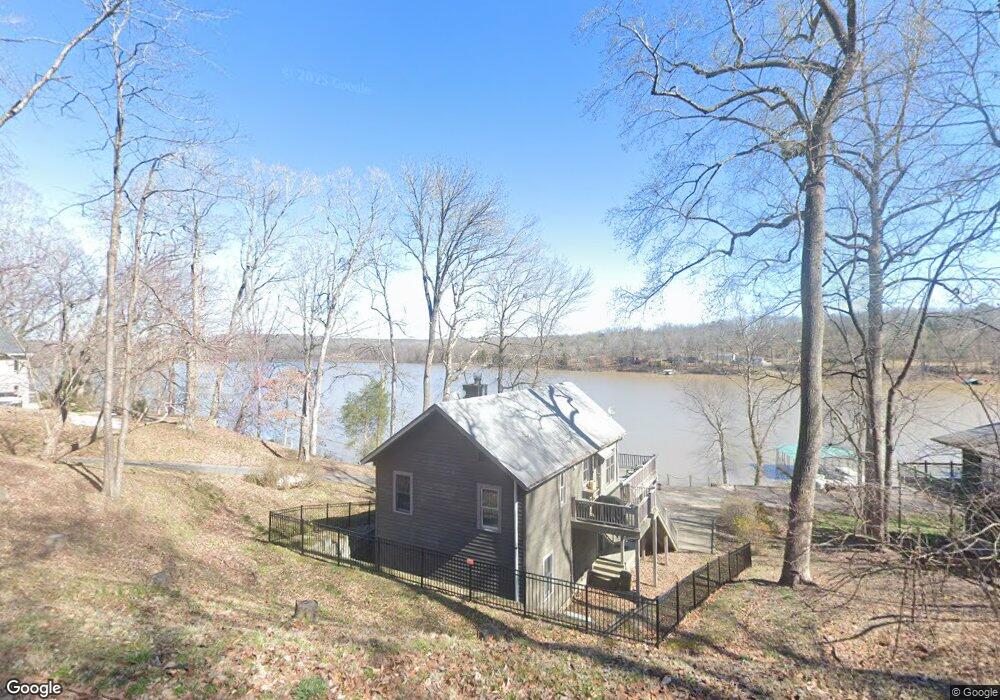
780 Stirling Rd Camden, TN 38320
Estimated Value: $373,000 - $566,000
--
Bed
2
Baths
2,400
Sq Ft
$194/Sq Ft
Est. Value
About This Home
This home is located at 780 Stirling Rd, Camden, TN 38320 and is currently estimated at $464,914, approximately $193 per square foot. 780 Stirling Rd is a home located in Benton County with nearby schools including Camden Elementary School, Briarwood School, and Camden Junior High School.
Ownership History
Date
Name
Owned For
Owner Type
Purchase Details
Closed on
May 1, 2020
Sold by
Williams Richard E and Williams Lisa R
Bought by
Lavender Kenneth Allen and Lavender Terri Lisa
Current Estimated Value
Purchase Details
Closed on
Jun 27, 2012
Sold by
Pinnacle National Bank Suc
Bought by
Williams Richard E and Bowers Lisa R
Purchase Details
Closed on
Sep 13, 2011
Sold by
Suntrust Bank Trustee
Bought by
Pinnacle National Bank Suc Tru
Purchase Details
Closed on
Mar 18, 2005
Sold by
Spitzer Roxane B
Bought by
Sun Trust Bank Trustee and Tn Nashville 6500 Trust
Purchase Details
Closed on
Feb 8, 2005
Sold by
Not Provided
Bought by
Not Provided
Purchase Details
Closed on
Oct 18, 2002
Bought by
Spitzer Roxane B and Spitzer Fleshwood H
Purchase Details
Closed on
Aug 25, 1995
Sold by
Skelton James H
Bought by
Skelton James H
Purchase Details
Closed on
Jun 23, 1995
Sold by
Bradley S P
Bought by
Skelton James H
Purchase Details
Closed on
Sep 6, 1989
Bought by
Joan Ann Steed
Create a Home Valuation Report for This Property
The Home Valuation Report is an in-depth analysis detailing your home's value as well as a comparison with similar homes in the area
Home Values in the Area
Average Home Value in this Area
Purchase History
| Date | Buyer | Sale Price | Title Company |
|---|---|---|---|
| Lavender Kenneth Allen | $325,000 | Bankers T&E Dickson Llc | |
| Williams Richard E | $300,000 | -- | |
| Pinnacle National Bank Suc Tru | -- | -- | |
| Sun Trust Bank Trustee | -- | -- | |
| Not Provided | $310,000 | -- | |
| Spitzer Roxane B | $305,000 | -- | |
| Skelton James H | $103,194 | -- | |
| Skelton James H | $35,000 | -- | |
| Joan Ann Steed | -- | -- |
Source: Public Records
Tax History Compared to Growth
Tax History
| Year | Tax Paid | Tax Assessment Tax Assessment Total Assessment is a certain percentage of the fair market value that is determined by local assessors to be the total taxable value of land and additions on the property. | Land | Improvement |
|---|---|---|---|---|
| 2024 | $1,825 | $66,900 | $27,000 | $39,900 |
| 2023 | $1,825 | $66,900 | $27,000 | $39,900 |
| 2022 | $1,825 | $66,900 | $27,000 | $39,900 |
| 2021 | $1,825 | $66,900 | $27,000 | $39,900 |
| 2020 | $1,826 | $66,900 | $27,000 | $39,900 |
| 2019 | $1,859 | $63,025 | $22,500 | $40,525 |
| 2018 | $1,859 | $63,025 | $22,500 | $40,525 |
| 2017 | $1,859 | $63,025 | $22,500 | $40,525 |
| 2016 | $1,822 | $61,775 | $22,500 | $39,275 |
| 2015 | $1,847 | $61,775 | $22,500 | $39,275 |
| 2014 | $1,781 | $61,775 | $22,500 | $39,275 |
| 2013 | $1,781 | $60,583 | $0 | $0 |
Source: Public Records
Map
Nearby Homes
- 682 Stirling Rd
- 844 Stirling Rd
- 000 Kinnaird Access Rd
- 50 Dingus Ln
- 370 Alpine Rd
- 100 Camelot Dr
- 45 Camelot Dr
- 317 Mcduff Ln
- 199 Argyll Rd
- 162 Stirling Rd
- 000 Clydesdale Rd
- 255 Hartley Rd
- Lot 10 Beaverdam Cabin Rd
- 000 Highlander Rd
- 44 G & S Rock Ranch Rd
- 0 Jeff Davis Dr
- lot 9 Sales Landing Rd
- 7 Sales Landing Rd
- 6 Sales Landing Rd
- Lot 7 Sales Landing Rd
- 754 Stirling Rd
- 820 Stirling Rd
- 740 Stirling Rd
- 710 Stirling Rd
- 696 Stirling Rd
- 805 Alpine Rd
- 811 Alpine Rd
- 868 Stirling Rd
- 670 Stirling Rd
- 670 Stirling Rd
- 890 Stirling Rd
- 825 Alpine Rd
- 665 Alpine Rd
- 0 Stirling Access Rd Unit 125646
- 000 Stirling Access Rd
- 634 Stirling Rd
- 645 Alpine Rd
- 0 Highlander Rd
- 0 Highlander Rd
- 641 Stirling Rd