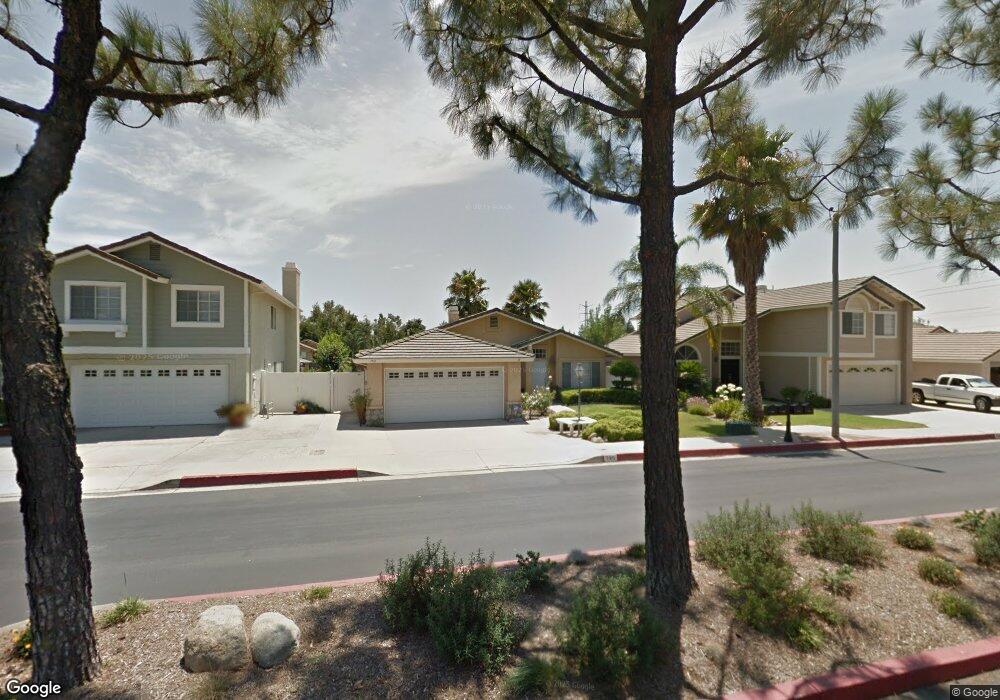
780 Viewpoint St Upland, CA 91784
Estimated Value: $728,007 - $805,000
3
Beds
2
Baths
1,401
Sq Ft
$554/Sq Ft
Est. Value
About This Home
This home is located at 780 Viewpoint St, Upland, CA 91784 and is currently estimated at $776,502, approximately $554 per square foot. 780 Viewpoint St is a home located in San Bernardino County with nearby schools including Foothill Knolls STEM Academy of Innovation, Upland High School, and St. Joseph Elementary School.
Ownership History
Date
Name
Owned For
Owner Type
Purchase Details
Closed on
May 17, 2010
Sold by
Wilson Robert L
Bought by
Lin Chauncey Changehih and Liao Jeanine Chinyen
Current Estimated Value
Purchase Details
Closed on
Nov 7, 2001
Sold by
Obrien John and Obrien Heather
Bought by
Wilson Robert L and Wilson Betty L
Purchase Details
Closed on
Jan 31, 1997
Sold by
Leming Joe E and Leming Barbara
Bought by
Obrien John and Obrien Heather
Home Financials for this Owner
Home Financials are based on the most recent Mortgage that was taken out on this home.
Original Mortgage
$139,650
Interest Rate
7.86%
Create a Home Valuation Report for This Property
The Home Valuation Report is an in-depth analysis detailing your home's value as well as a comparison with similar homes in the area
Home Values in the Area
Average Home Value in this Area
Purchase History
| Date | Buyer | Sale Price | Title Company |
|---|---|---|---|
| Lin Chauncey Changehih | $340,000 | Fidelity National Title Co | |
| Wilson Robert L | $240,000 | First American Title Co | |
| Obrien John | $147,000 | Continental Lawyers Title Co |
Source: Public Records
Mortgage History
| Date | Status | Borrower | Loan Amount |
|---|---|---|---|
| Previous Owner | Obrien John | $139,650 |
Source: Public Records
Tax History
| Year | Tax Paid | Tax Assessment Tax Assessment Total Assessment is a certain percentage of the fair market value that is determined by local assessors to be the total taxable value of land and additions on the property. | Land | Improvement |
|---|---|---|---|---|
| 2025 | $4,841 | $438,881 | $153,608 | $285,273 |
| 2024 | $4,686 | $430,275 | $150,596 | $279,679 |
| 2023 | $4,614 | $421,838 | $147,643 | $274,195 |
| 2022 | $4,513 | $413,567 | $144,748 | $268,819 |
| 2021 | $4,506 | $405,458 | $141,910 | $263,548 |
| 2020 | $4,383 | $401,301 | $140,455 | $260,846 |
| 2019 | $4,367 | $393,432 | $137,701 | $255,731 |
| 2018 | $4,260 | $385,718 | $135,001 | $250,717 |
| 2017 | $4,136 | $378,155 | $132,354 | $245,801 |
| 2016 | $3,926 | $370,740 | $129,759 | $240,981 |
| 2015 | $3,836 | $365,171 | $127,810 | $237,361 |
| 2014 | $3,736 | $358,017 | $125,306 | $232,711 |
Source: Public Records
Map
Nearby Homes
- 1015 Pebble Beach Dr
- 1060 Pebble Beach Dr Unit 58
- 1267 Kendra Ln
- 1182 Upland Hills Dr S
- 1844 N 1st Ave
- 1837 N 1st Ave
- 1409 Upland Hills Dr N Unit N
- 1942 N 3rd Ave
- 1842 Richards Place
- 655 Doreen Ct
- 1855 Old Baldy Way
- 1418 Winston Ct
- 1695 N Palm Ave
- 1629 N Palm Ave
- 1393 Bouquet Dr
- 1448 N Euclid Ave
- 1370 Edgefield St
- 1382 Crawford Ave
- 1535 Upland Hills Dr S
- 171 E 14th St
- 764 Viewpoint St
- 779 Mesa View St
- 810 Viewpoint St
- 750 Viewpoint St
- 765 Mesa View St
- 797 Mesa View St
- 1733 Oakview Way
- 811 Mesa View St
- 749 Mesa View St
- 826 Viewpoint St
- 1736 Eastview Ave
- 827 Mesa View St
- 1734 Oakview Way
- 1741 Oakview Way
- 840 Viewpoint St
- 1740 Eastview Ave
- 1725 Eastview Ave
- 1721 Eastview Ave
- 841 Mesa View St
- 780 Mesa View St
Your Personal Tour Guide
Ask me questions while you tour the home.