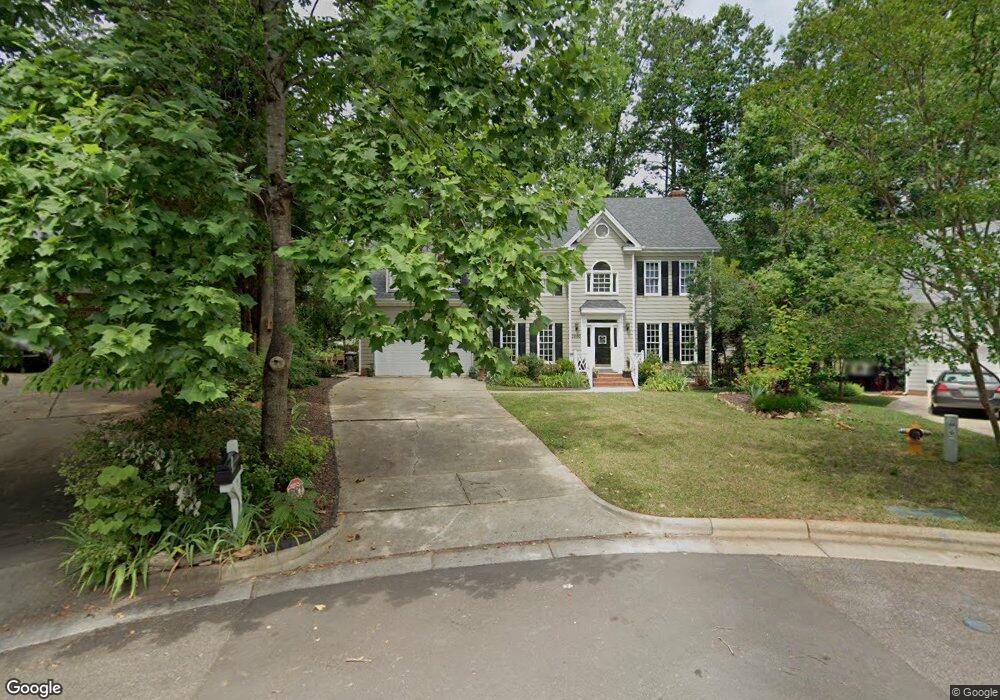
7800 Ocoee Ct Raleigh, NC 27612
Northwest Raleigh NeighborhoodEstimated Value: $650,000 - $685,000
3
Beds
3
Baths
2,360
Sq Ft
$283/Sq Ft
Est. Value
About This Home
This home is located at 7800 Ocoee Ct, Raleigh, NC 27612 and is currently estimated at $667,911, approximately $283 per square foot. 7800 Ocoee Ct is a home located in Wake County with nearby schools including Leesville Road Elementary School, Leesville Road Middle School, and Leesville Road High School.
Ownership History
Date
Name
Owned For
Owner Type
Purchase Details
Closed on
Nov 14, 2013
Sold by
Steinbock Delmar David and Steinbock Wendi S
Bought by
Steinbock Wendi S and Scott Jane W
Current Estimated Value
Home Financials for this Owner
Home Financials are based on the most recent Mortgage that was taken out on this home.
Original Mortgage
$275,000
Outstanding Balance
$205,081
Interest Rate
4.23%
Mortgage Type
New Conventional
Estimated Equity
$462,830
Purchase Details
Closed on
Dec 3, 2009
Sold by
Hollerung C William and Hollerung Jennifer
Bought by
Steinbock Delmar David and Steinbock Wendi S
Home Financials for this Owner
Home Financials are based on the most recent Mortgage that was taken out on this home.
Original Mortgage
$289,800
Interest Rate
4.98%
Mortgage Type
New Conventional
Create a Home Valuation Report for This Property
The Home Valuation Report is an in-depth analysis detailing your home's value as well as a comparison with similar homes in the area
Home Values in the Area
Average Home Value in this Area
Purchase History
| Date | Buyer | Sale Price | Title Company |
|---|---|---|---|
| Steinbock Wendi S | -- | None Available | |
| Steinbock Delmar David | $322,000 | Chicago Title Insurance Co |
Source: Public Records
Mortgage History
| Date | Status | Borrower | Loan Amount |
|---|---|---|---|
| Open | Steinbock Wendi S | $275,000 | |
| Closed | Steinbock Delmar David | $289,800 |
Source: Public Records
Tax History
| Year | Tax Paid | Tax Assessment Tax Assessment Total Assessment is a certain percentage of the fair market value that is determined by local assessors to be the total taxable value of land and additions on the property. | Land | Improvement |
|---|---|---|---|---|
| 2025 | $5,453 | $622,926 | $240,000 | $382,926 |
| 2024 | $5,430 | $622,926 | $240,000 | $382,926 |
Source: Public Records
Map
Nearby Homes
- 8005 Looking Glass Ct
- 7504 Panther Branch Dr
- 7710 Astoria Place
- 8005 Sycamore Hill Ln
- 8016 Sycamore Hill Ln
- 8006 Goldenrain Way
- 8118 Primanti Blvd
- 8041 Sycamore Hill Ln
- 8729 Cypress Grove Run
- 8815 Orchard Grove Way
- 8015 Sunset Branch Ct
- 8307 Stonetown Ave
- 6701 Westborough Dr
- 8116 Ortin Ln
- 7226 Corvette Ct
- 7233 Galon Glen Rd
- 5529 Golden Arrow Ln
- 8204 Pilots View Dr
- 7751 San Gabriel St
- 8216 Beaded Stone St
- 7801 Ocoee Ct
- 7804 Ocoee Ct
- 7908 Gabriels Bend Dr
- 7900 Gabriels Bend Dr
- 7808 Ocoee Ct
- 7912 Gabriels Bend Dr
- 7805 Ocoee Ct
- 7916 Gabriels Bend Dr
- 7813 Ocoee Ct
- 7919 Longleaf Branch Ct Unit Lt9
- 7919 Longleaf Branch Ct
- 7517 Pats Branch Dr
- 7921 Longleaf Branch Ct
- 7809 Ocoee Ct
- 7305 Dogwood Branch Ct
- 7901 Gabriels Bend Dr
- 7920 Gabriels Bend Dr
- 7300 Dogwood Branch Ct
- 7309 Dogwood Branch Ct Unit 8
- 7309 Dogwood Branch Ct
Your Personal Tour Guide
Ask me questions while you tour the home.