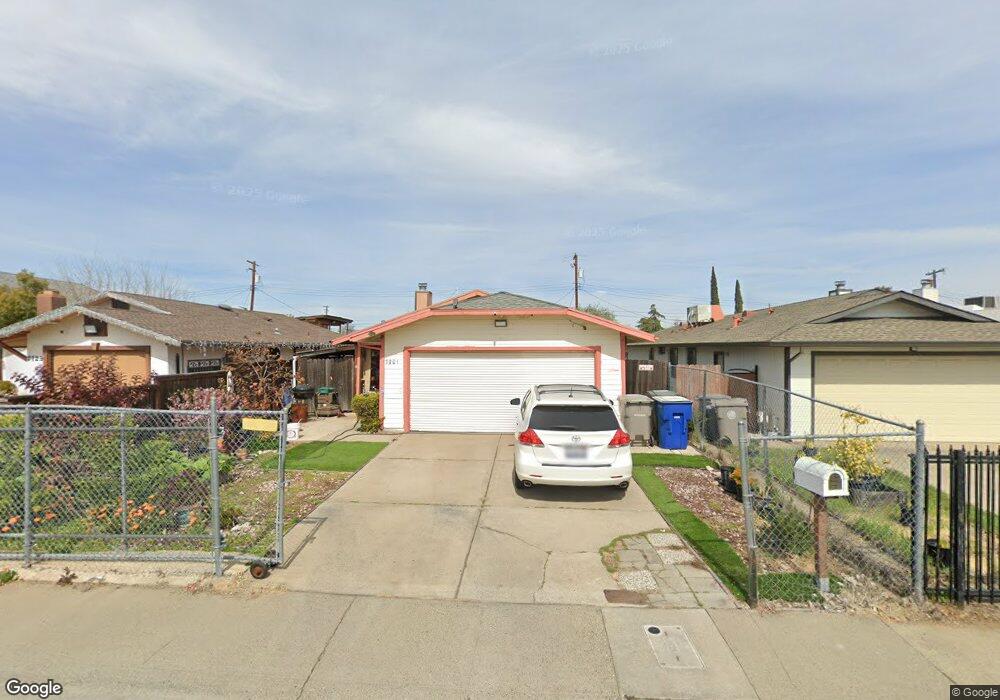
7801 39th Ave Sacramento, CA 95824
Avondale NeighborhoodEstimated Value: $314,000 - $444,000
4
Beds
2
Baths
1,484
Sq Ft
$264/Sq Ft
Est. Value
About This Home
This home is located at 7801 39th Ave, Sacramento, CA 95824 and is currently estimated at $391,768, approximately $263 per square foot. 7801 39th Ave is a home located in Sacramento County with nearby schools including Elder Creek Elementary School, Will C. Wood Middle School, and Hiram W. Johnson High School.
Ownership History
Date
Name
Owned For
Owner Type
Purchase Details
Closed on
Mar 13, 2025
Sold by
Hoang Ung Dinh and Hoang Loe Dinh
Bought by
Hoang Chi Dinh
Current Estimated Value
Purchase Details
Closed on
Aug 2, 2017
Sold by
Dinh Hoang Una Dinh and Dinh Hoang Su
Bought by
Dinh Hoang Una Dinh and Dinh Hoang Loe
Purchase Details
Closed on
Aug 4, 2009
Sold by
Hoang Ung Dinh
Bought by
Zhang Jiu Ya
Purchase Details
Closed on
Sep 20, 1999
Sold by
Hoang Su Dinh and Ung Dinh
Bought by
Dinh Hoang Ung Dinh and Dinh Hoang Su
Home Financials for this Owner
Home Financials are based on the most recent Mortgage that was taken out on this home.
Original Mortgage
$68,000
Interest Rate
8.09%
Mortgage Type
Stand Alone First
Purchase Details
Closed on
May 11, 1999
Sold by
Hoang Su Dinh
Bought by
Hoang Ung Dinh
Create a Home Valuation Report for This Property
The Home Valuation Report is an in-depth analysis detailing your home's value as well as a comparison with similar homes in the area
Home Values in the Area
Average Home Value in this Area
Purchase History
| Date | Buyer | Sale Price | Title Company |
|---|---|---|---|
| Hoang Chi Dinh | -- | None Listed On Document | |
| Hoang Chi Dinh | -- | None Listed On Document | |
| Dinh Hoang Una Dinh | -- | None Available | |
| Zhang Jiu Ya | -- | None Available | |
| Dinh Hoang Ung Dinh | -- | Financial Title Company | |
| Hoang Ung Dinh | -- | -- |
Source: Public Records
Mortgage History
| Date | Status | Borrower | Loan Amount |
|---|---|---|---|
| Previous Owner | Dinh Hoang Ung Dinh | $68,000 |
Source: Public Records
Tax History Compared to Growth
Tax History
| Year | Tax Paid | Tax Assessment Tax Assessment Total Assessment is a certain percentage of the fair market value that is determined by local assessors to be the total taxable value of land and additions on the property. | Land | Improvement |
|---|---|---|---|---|
| 2025 | $2,083 | $172,681 | $37,418 | $135,263 |
| 2024 | $2,083 | $169,296 | $36,685 | $132,611 |
| 2023 | $2,032 | $165,977 | $35,966 | $130,011 |
| 2022 | $1,995 | $162,723 | $35,261 | $127,462 |
| 2021 | $1,902 | $159,533 | $34,570 | $124,963 |
| 2020 | $1,913 | $157,898 | $34,216 | $123,682 |
| 2019 | $1,872 | $154,803 | $33,546 | $121,257 |
| 2018 | $1,822 | $151,769 | $32,889 | $118,880 |
| 2017 | $1,471 | $120,366 | $26,743 | $93,623 |
| 2016 | $1,435 | $118,007 | $26,219 | $91,788 |
| 2015 | $1,412 | $116,236 | $25,826 | $90,410 |
| 2014 | $1,375 | $113,960 | $25,321 | $88,639 |
Source: Public Records
Map
Nearby Homes
- 7440 38th Ave
- 7922 35th Ave
- 7909 35th Ave
- 6152 Lemon Bell Way
- 5690 Power Inn Rd
- 5618 Wilkinson St
- 6240 Sunrise Dr S
- 6801 38th Ave
- 6306 Fall River Way
- 7021 Fruitridge Rd
- 5 Enniskillen Ct
- 6451 Elder Creek Rd
- 5411 70th St
- 7441 Peacock Way
- 5351 Whittier Dr
- 7330 Peacock Way
- 5853 64th St
- 5240 Emerson Rd
- 5210 71st St
- 7735 51st Ave