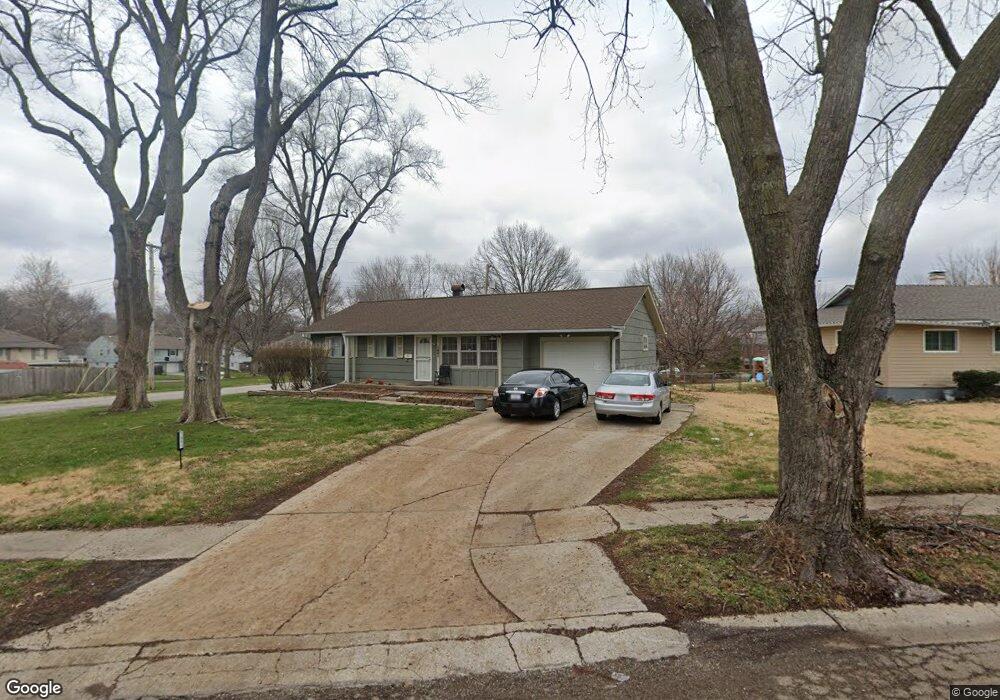
7801 E 87th Terrace Kansas City, MO 64138
Fairwood & Robandee NeighborhoodEstimated Value: $177,000 - $202,000
3
Beds
1
Bath
1,400
Sq Ft
$132/Sq Ft
Est. Value
About This Home
This home is located at 7801 E 87th Terrace, Kansas City, MO 64138 and is currently estimated at $184,906, approximately $132 per square foot. 7801 E 87th Terrace is a home located in Jackson County with nearby schools including Dobbs Elementary School, St Regis School, and Carver Christian Academy.
Ownership History
Date
Name
Owned For
Owner Type
Purchase Details
Closed on
Dec 6, 2023
Sold by
Vb One Llc
Bought by
Vinebrook Homes Borrower 1 Llc
Current Estimated Value
Home Financials for this Owner
Home Financials are based on the most recent Mortgage that was taken out on this home.
Original Mortgage
$392,180,000
Outstanding Balance
$384,753,385
Interest Rate
7.79%
Mortgage Type
New Conventional
Estimated Equity
-$384,568,479
Purchase Details
Closed on
Apr 5, 2021
Sold by
Landmark Equity Group Llc
Bought by
Vb One Llc
Purchase Details
Closed on
May 20, 2019
Sold by
Packnett Betty J and Packnett David
Bought by
Landmark Equity Group Llc
Purchase Details
Closed on
Jun 14, 1996
Sold by
Flagg Kenneth and Flagg Nancy
Bought by
Packnett David and Packnett Betty J
Home Financials for this Owner
Home Financials are based on the most recent Mortgage that was taken out on this home.
Original Mortgage
$65,450
Interest Rate
8.1%
Mortgage Type
Purchase Money Mortgage
Create a Home Valuation Report for This Property
The Home Valuation Report is an in-depth analysis detailing your home's value as well as a comparison with similar homes in the area
Home Values in the Area
Average Home Value in this Area
Purchase History
| Date | Buyer | Sale Price | Title Company |
|---|---|---|---|
| Vinebrook Homes Borrower 1 Llc | -- | None Listed On Document | |
| Vb One Llc | -- | Tital Title Services | |
| Landmark Equity Group Llc | -- | Coffelt Land Title Inc | |
| Packnett David | -- | Old Republic Title Company |
Source: Public Records
Mortgage History
| Date | Status | Borrower | Loan Amount |
|---|---|---|---|
| Open | Vinebrook Homes Borrower 1 Llc | $392,180,000 | |
| Previous Owner | Packnett David | $65,450 |
Source: Public Records
Tax History
| Year | Tax Paid | Tax Assessment Tax Assessment Total Assessment is a certain percentage of the fair market value that is determined by local assessors to be the total taxable value of land and additions on the property. | Land | Improvement |
|---|---|---|---|---|
| 2025 | $1,899 | $20,855 | $2,645 | $18,210 |
| 2024 | $1,899 | $21,936 | $2,451 | $19,485 |
| 2023 | $1,865 | $21,935 | $2,031 | $19,904 |
| 2022 | $1,562 | $15,770 | $2,660 | $13,110 |
| 2021 | $1,347 | $15,770 | $2,660 | $13,110 |
| 2020 | $1,387 | $15,347 | $2,660 | $12,687 |
| 2019 | $1,312 | $15,347 | $2,660 | $12,687 |
| 2018 | $1,377 | $15,048 | $3,521 | $11,527 |
| 2017 | $1,377 | $15,048 | $3,521 | $11,527 |
| 2016 | $1,383 | $14,670 | $3,091 | $11,579 |
Source: Public Records
Map
Nearby Homes
- 7916 E 88th Terrace
- 7911 E 88th Terrace
- 7814 E 86th St
- 9250 Blue Ridge Blvd
- 8513 Blue Ridge Blvd
- 7718 E 90th Terrace
- 7722 E 90th Terrace
- 8428 James A Reed Rd
- 8600 Crystal Ave
- 8416 Greenwood Rd
- 8219 E 85th St
- 7129 E 87th St
- 7413 Loma Vista Dr
- 7207 E 86th St
- 8409 E 85th St
- 8512 E 85th St
- 8605 Everett St
- 8605 Cambridge Ave
- 9211 Manchester Ave
- 9214 Manchester Ave
- 8715 Manchester Ave
- 8710 Manchester Ave
- 7811 E 87th Terrace
- 8708 Manchester Ave
- 7810 E 87th Terrace
- 8716 Manchester Ave
- 7815 E 87th Terrace
- 8712 Manchester Ave
- 7814 E 87th Terrace
- 8706 Manchester Ave
- 7810 E 88th St
- 8704 Manchester Ave
- 7712 E 88th St
- 7814 E 88th St
- 8701 Manchester Ave
- 7811 E 87th St
- 7807 E 87th St
- 8723 Sycamore Ave
- 8709 Sycamore Ave
- 8721 Sycamore Ave
Your Personal Tour Guide
Ask me questions while you tour the home.